


Category filter
PowerShell script to get performance counter data from Windows
TL;DR
Use PowerShell scripts with Hexnode UEM’s Execute Custom Script remote action to get performance counter data from Windows device, helping IT admins investigate system slowdowns and resource bottlenecks. By executing the Get-Counter cmdlet, IT administrators can discover metric paths, monitor specific subsystems like CPU or disk latency, and isolate resource bottlenecks.
Executive Summary
When a managed Windows device encounters performance issues, Hexnode UEM administrators can execute PowerShell scripts to get performance counter data from those devices without interrupting the end user. The collected data helps administrators compare resource usage against expected levels, spot unusual activity, and narrow down potential causes of slow performance. Administrators can view the script output under Manage > Endpoints > [select the target Windows endpoint] > Action History > Show Output and use the results to narrow down potential causes before proceeding with further troubleshooting.
What is performance counter data on Windows?
Performance counters are built-in Windows components that measure system resource usage, recording metrics such as CPU utilization, available memory, disk read/write activity, and network traffic.
The PowerShell Get-Counter cmdlet retrieves this performance data, allowing administrators to examine resource usage, identify potential bottlenecks, and investigate device performance issues.
What is the Get-Counter cmdlet?
The Get-Counter cmdlet is a built-in Windows PowerShell utility that retrieves performance counter data via the command line. When administrators deploy a PowerShell script containing the Get-Counter cmdlet through Hexnode UEM’s Execute Custom Script remote action, the script runs on the selected managed Windows endpoint and collects the requested performance metrics.
Script details and requirements
The following table outlines the environment properties and deployment prerequisites required before executing the scripts:
| Property | Specification |
|---|---|
| Scripting Language | PowerShell |
| File Extension | .ps1 |
| Deployment Method | Hexnode UEM portal via Execute Custom Script remote action |
| OS Support | Windows 10 (v1709+) and Windows 11 PCs/tablets. |
Syntax of the Get-Counter cmdlet
The Get-Counter cmdlet supports two primary operations: counter set discovery, which lists available performance counter sets, and metric sampling, which collects performance counter readings on a Windows device.
Parameter set 1: Counter set discovery
|
1 |
Get-Counter -ListSet <String[]> [<CommonParameters>] |
Parameter set 2: Metric sampling
|
1 2 3 4 5 |
Get-Counter [[-Counter] <String[]>] [-SampleInterval <Int32>] [-MaxSamples <Int64>] [<CommonParameters>] |
| Parameter | Description | Input Type |
|---|---|---|
| Get-Counter | A Windows PowerShell cmdlet that retrieves live performance counter data, such as CPU usage, available memory, disk I/O, and network statistics, from the Windows operating system. | Cmdlet |
| -ListSet | A parameter of the Get-Counter cmdlet that discovers and lists the available performance counter sets (categories) on a system. | String (optional) |
| -Counter | Specifies the performance counter paths to collect data from, such as CPU usage or disk activity. | String[] |
| -SampleInterval | Specifies the number of seconds between consecutive readings. | Int32 |
| -MaxSamples | Specifies the total number of readings to collect for each counter. | Int64 |
PowerShell deployment examples
1. Get all available counter sets
Execute the following script through Hexnode UEM to retrieve a complete list of available performance counter sets from the target Windows device.
|
1 |
Get-Counter -ListSet * |
How the script works:
| Component | Function |
|---|---|
| * | Wildcard character specifying that all available counter sets should be returned, including sets related to the processor, memory, physical disk, network interface, and system activity. |
When to use the script:
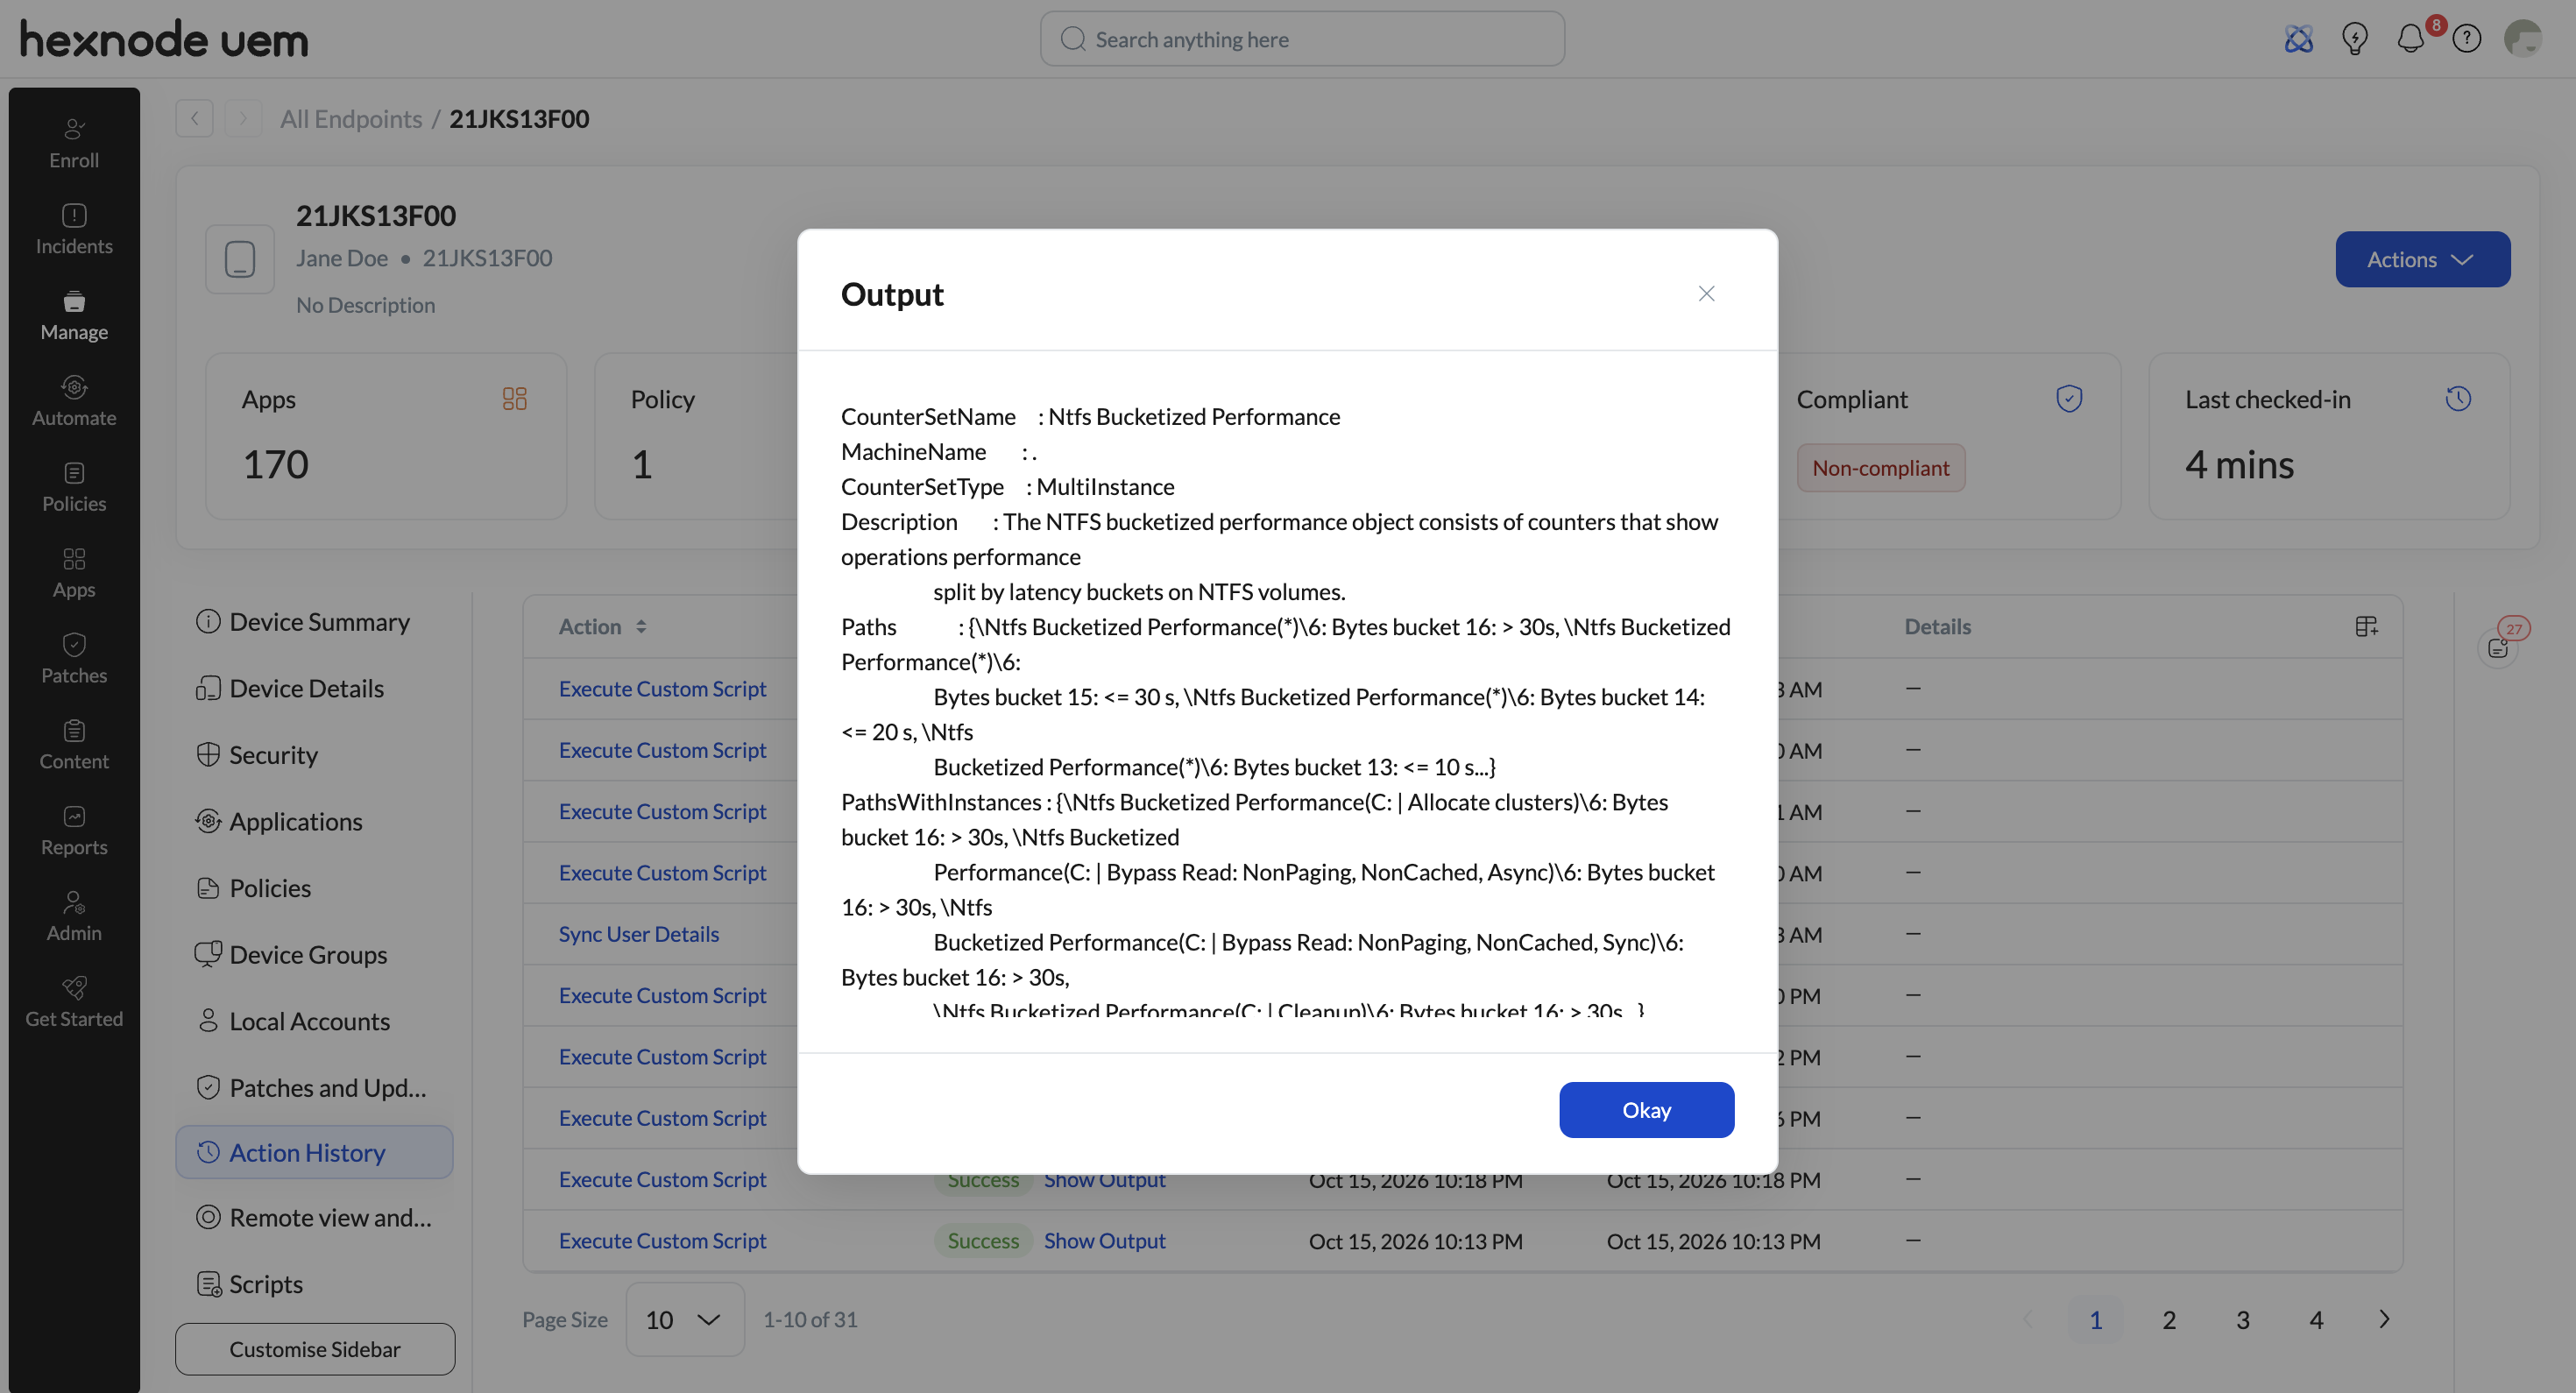
PowerShell script to get all available counter sets script helps administrators identify which sets correspond to the system components they want to monitor and determine the appropriate counter paths to use when collecting performance data. For example, they can examine the listed sets to find counters related to processor, memory, or network activity.
2. Fetch specific performance metrics
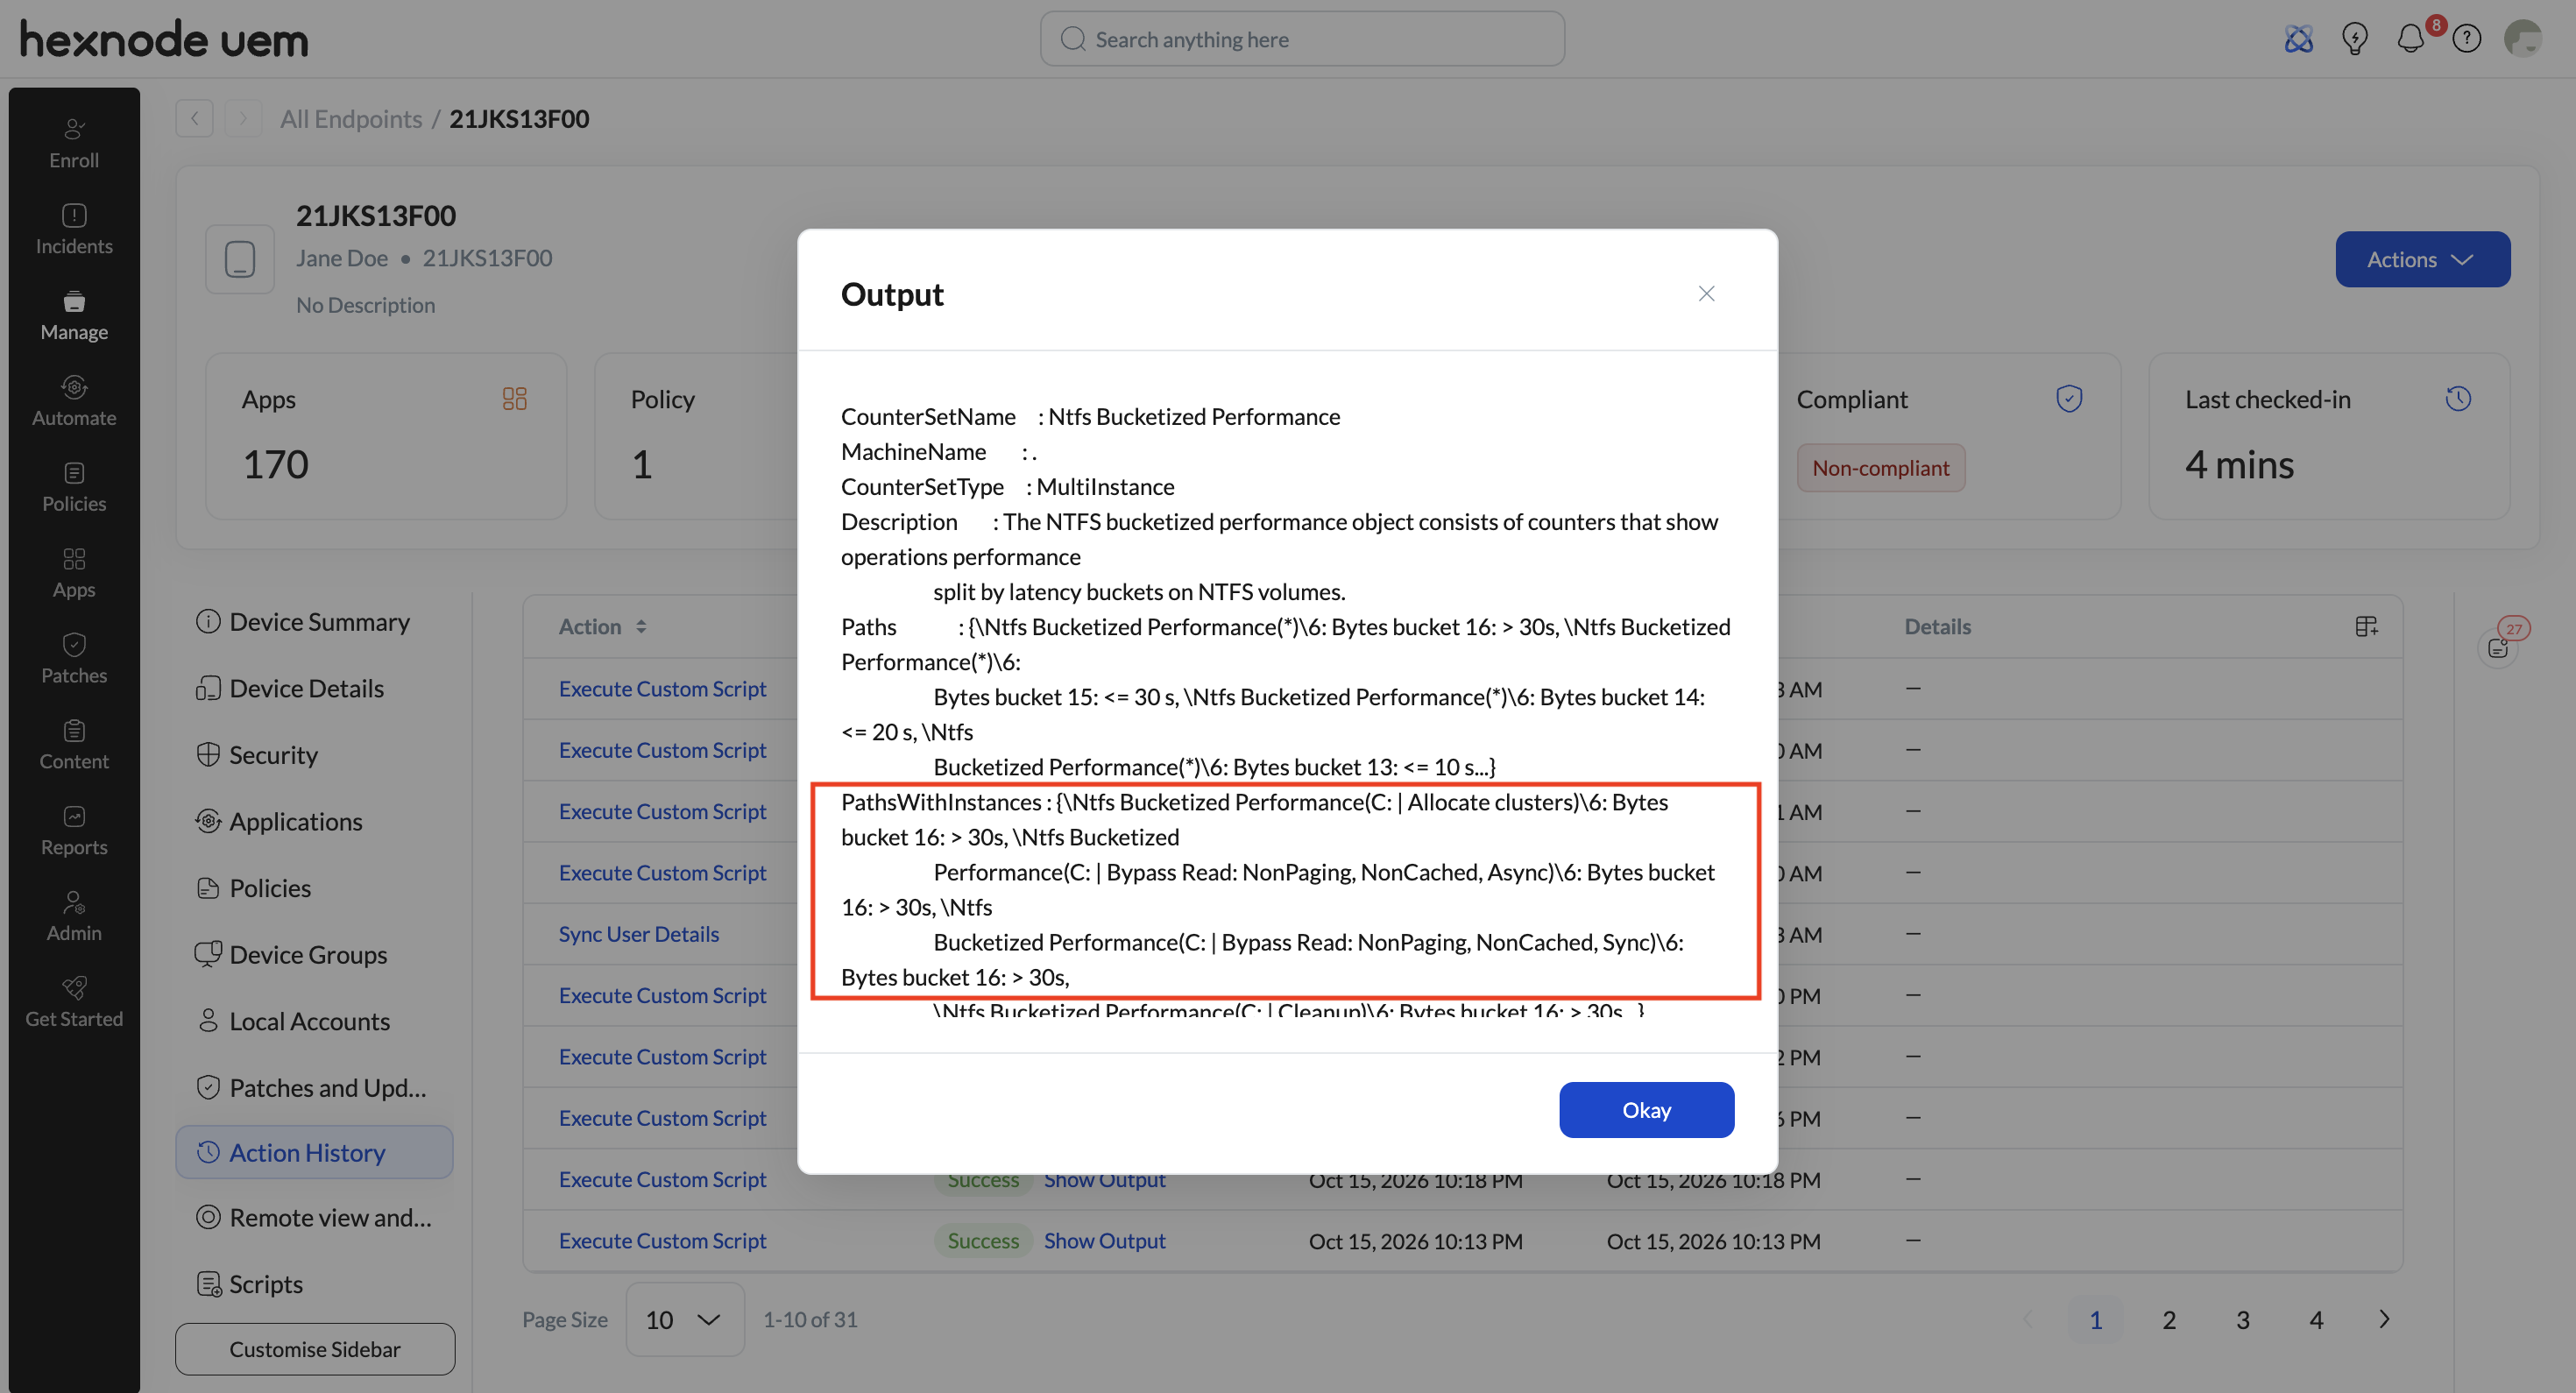
Deploy the following script via Hexnode UEM to retrieve performance counter data for a specific metric path obtained from the .PathsWithInstances property of the Get-Counter -ListSet command.
Syntax:
|
1 |
Get-Counter -Counter "PathsWithInstances" |
How the script works:
| Component | Function |
|---|---|
| “PathsWithInstances” | Replace the placeholder with a valid performance counter path copied from the PathsWithInstances property returned by Script 1 (Get-Counter -ListSet *). |
When to use the script:
Admins can deploy this script to troubleshoot device issues like app freezes, slow storage drives, or unresponsive applications. Querying a specific metric returns only the required data, reducing the overhead of querying entire counter categories and filtering out telemetry noise so administrators can isolate specific performance issues.
Example:
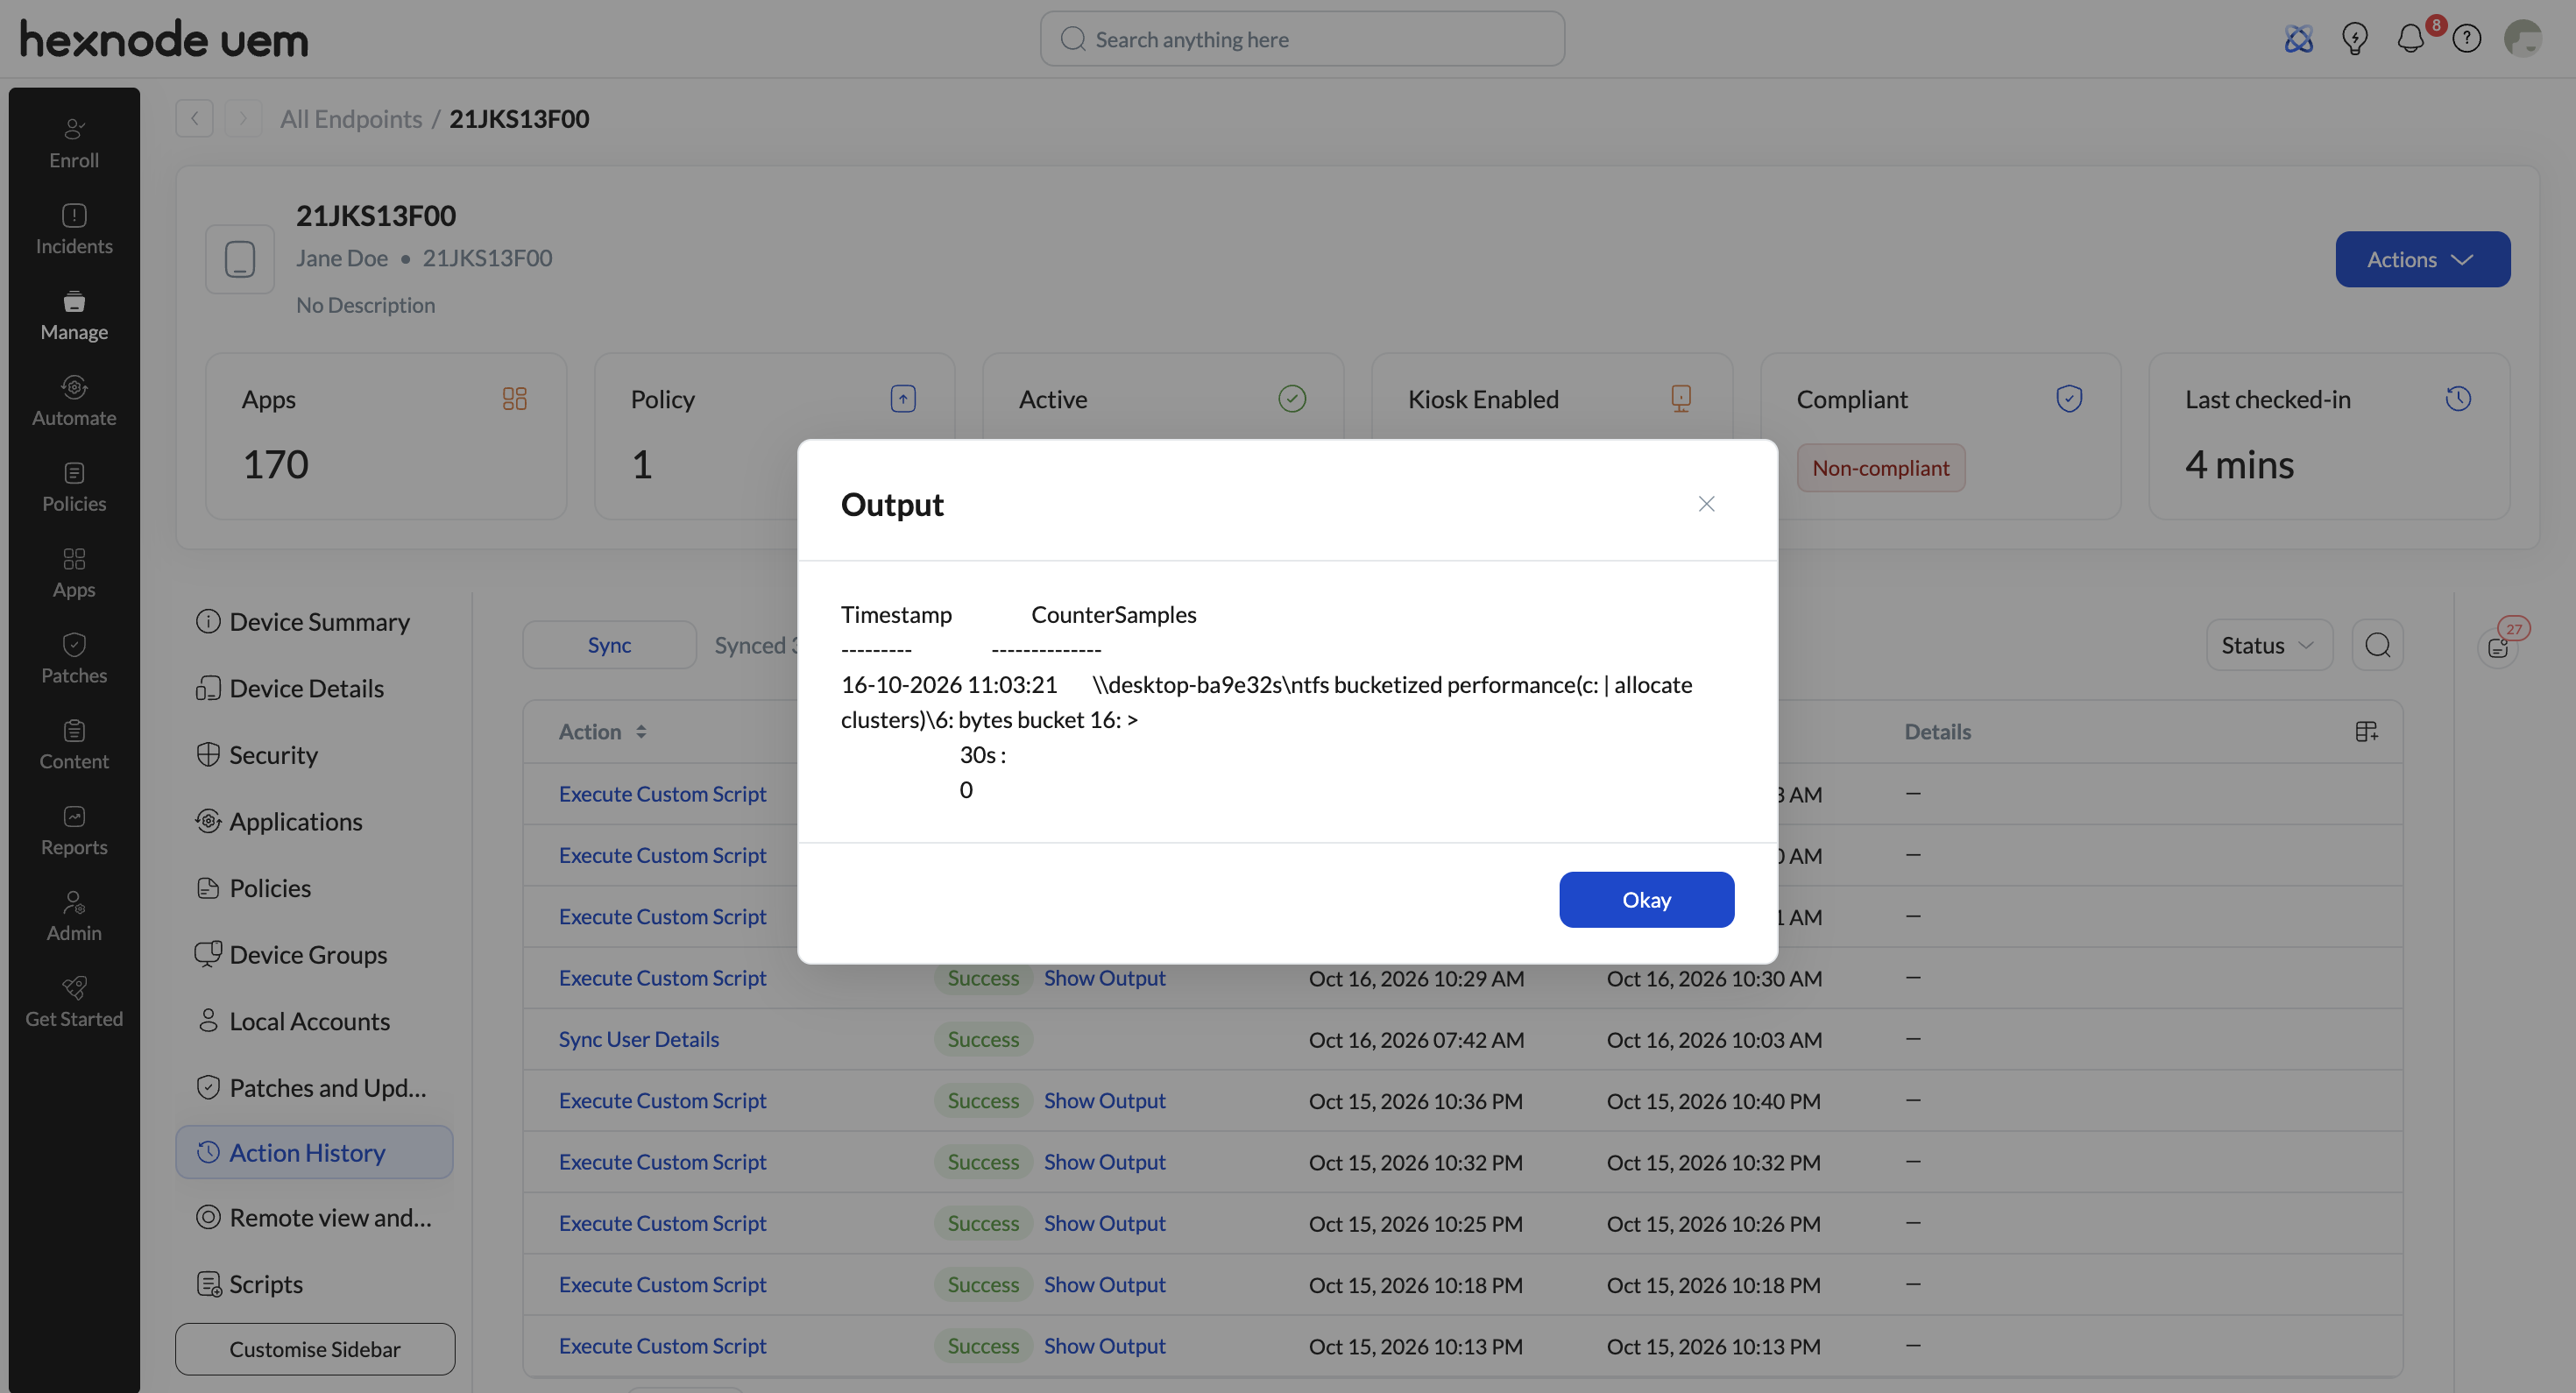
The following script retrieves the NTFS performance counter for operations taking longer than 30 seconds, helping administrators investigate slow file-saving operations or disk freezes on a managed Windows device:
|
1 |
Get-Counter -Counter "\Ntfs Bucketized Performance(C: | Allocate clusters)\6: Bytes bucket 16: > 30s" |
How to read the output:
The numeric value shown beneath the CounterSamples field indicates the number of cluster allocation requests on drive C: that took longer than 30 seconds. 0 means no requests exceeded this duration, while 1 or higher indicates that one or more requests took longer than 30 seconds to complete.
3. Fetch specific performance metrics over a time interval
Execute the following PowerShell script through Hexnode UEM to get specific performance counter data at regular, repeating intervals.
Syntax:
|
1 |
Get-Counter -Counter "PathsWithInstances" -SampleInterval <Seconds> -MaxSamples <Total_Samples> |
How the script works:
| Component | Function |
|---|---|
| “PathsWithInstances” | Replace the placeholder with a valid performance counter path copied from the PathsWithInstances property returned by Script 1 (Get-Counter -ListSet *). |
| -SampleInterval | Parameter that specifies the time delay (in seconds) between each consecutive sample collection. |
| <Seconds> | Placeholder to be replaced with the required interval in seconds. |
| -MaxSamples | Specifies the total number of samples to collect during a single execution of the Get-Counter command. |
| <Total_Samples> | Placeholder to be replaced with the required number of samples. |
When to use the script:
Admins can deploy this script to investigate issues such as CPU usage spikes, memory usage fluctuations, slow disk operations, or sudden changes in network activity. Collecting multiple samples at regular intervals helps admins to determine whether these changes are momentary or systemic on a managed Windows device.
Example:
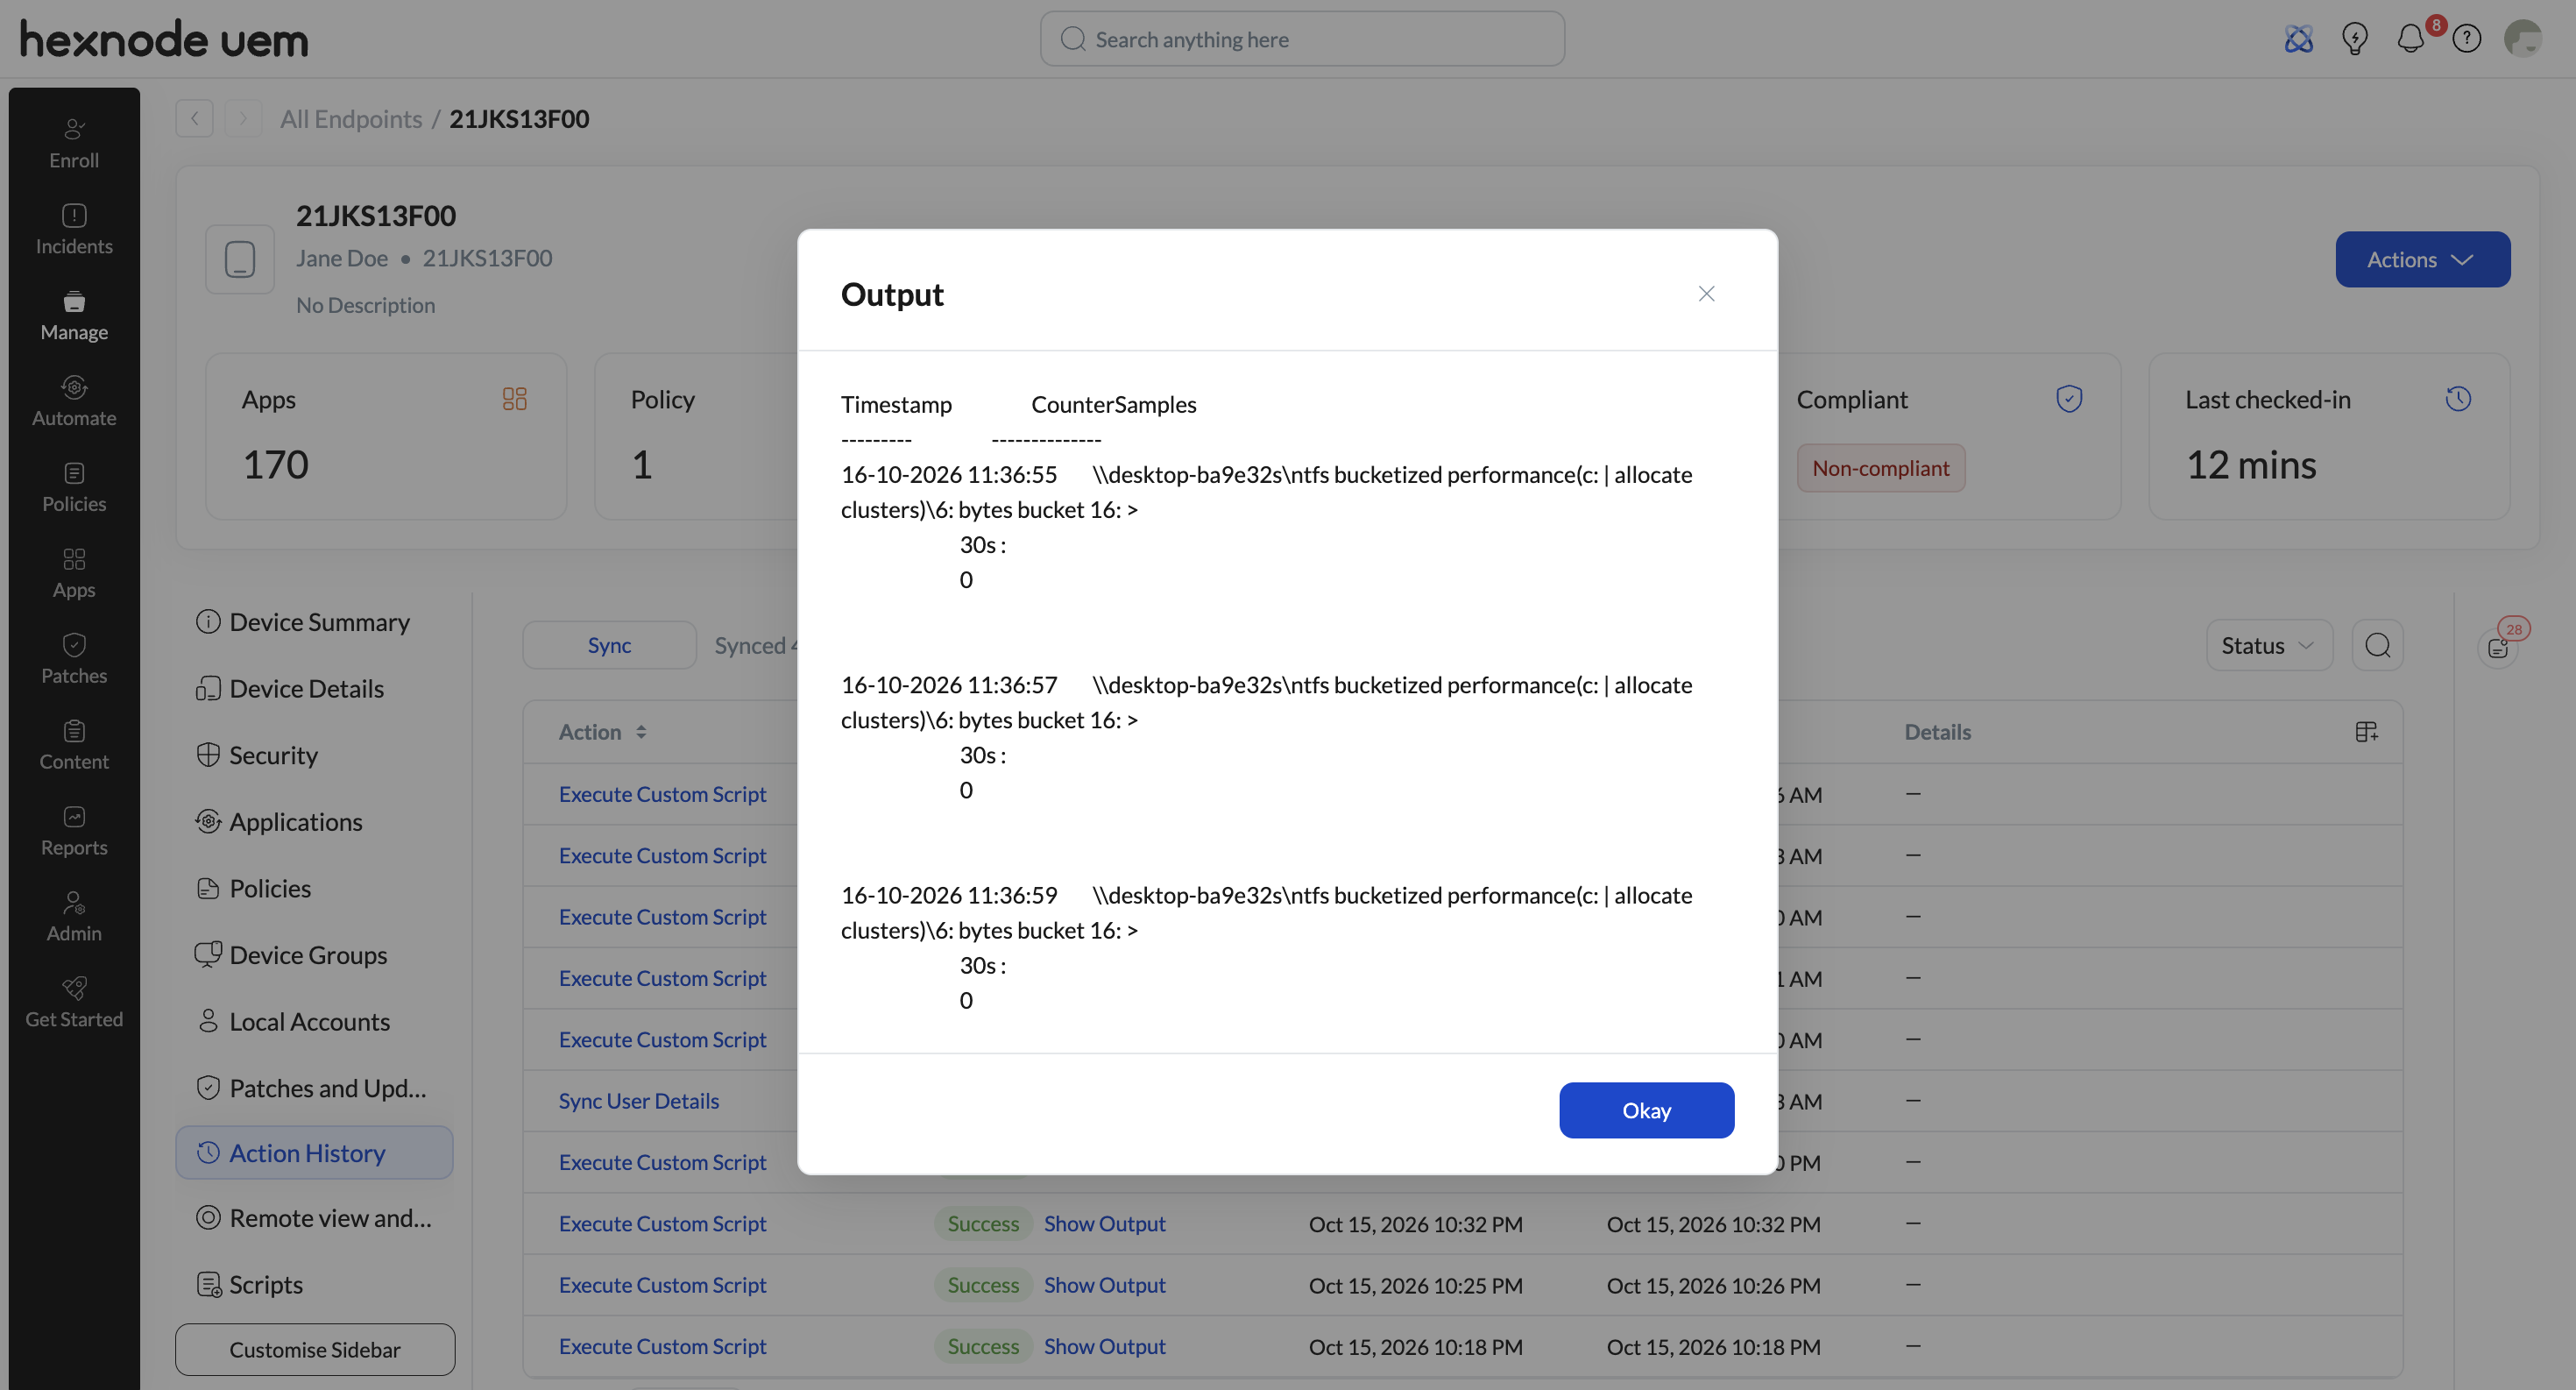
The following script collects three samples of the specified NTFS performance counter at two-second intervals to check whether long-running disk operations continue across multiple readings. Sampling completes automatically once all three samples have been collected.
|
1 |
Get-Counter -Counter "\Ntfs Bucketized Performance(C: | Allocate clusters)\6: Bytes bucket 16: > 30s" -SampleInterval 2 -MaxSamples 3 |
4. Fetch alphabetical list of counter sets
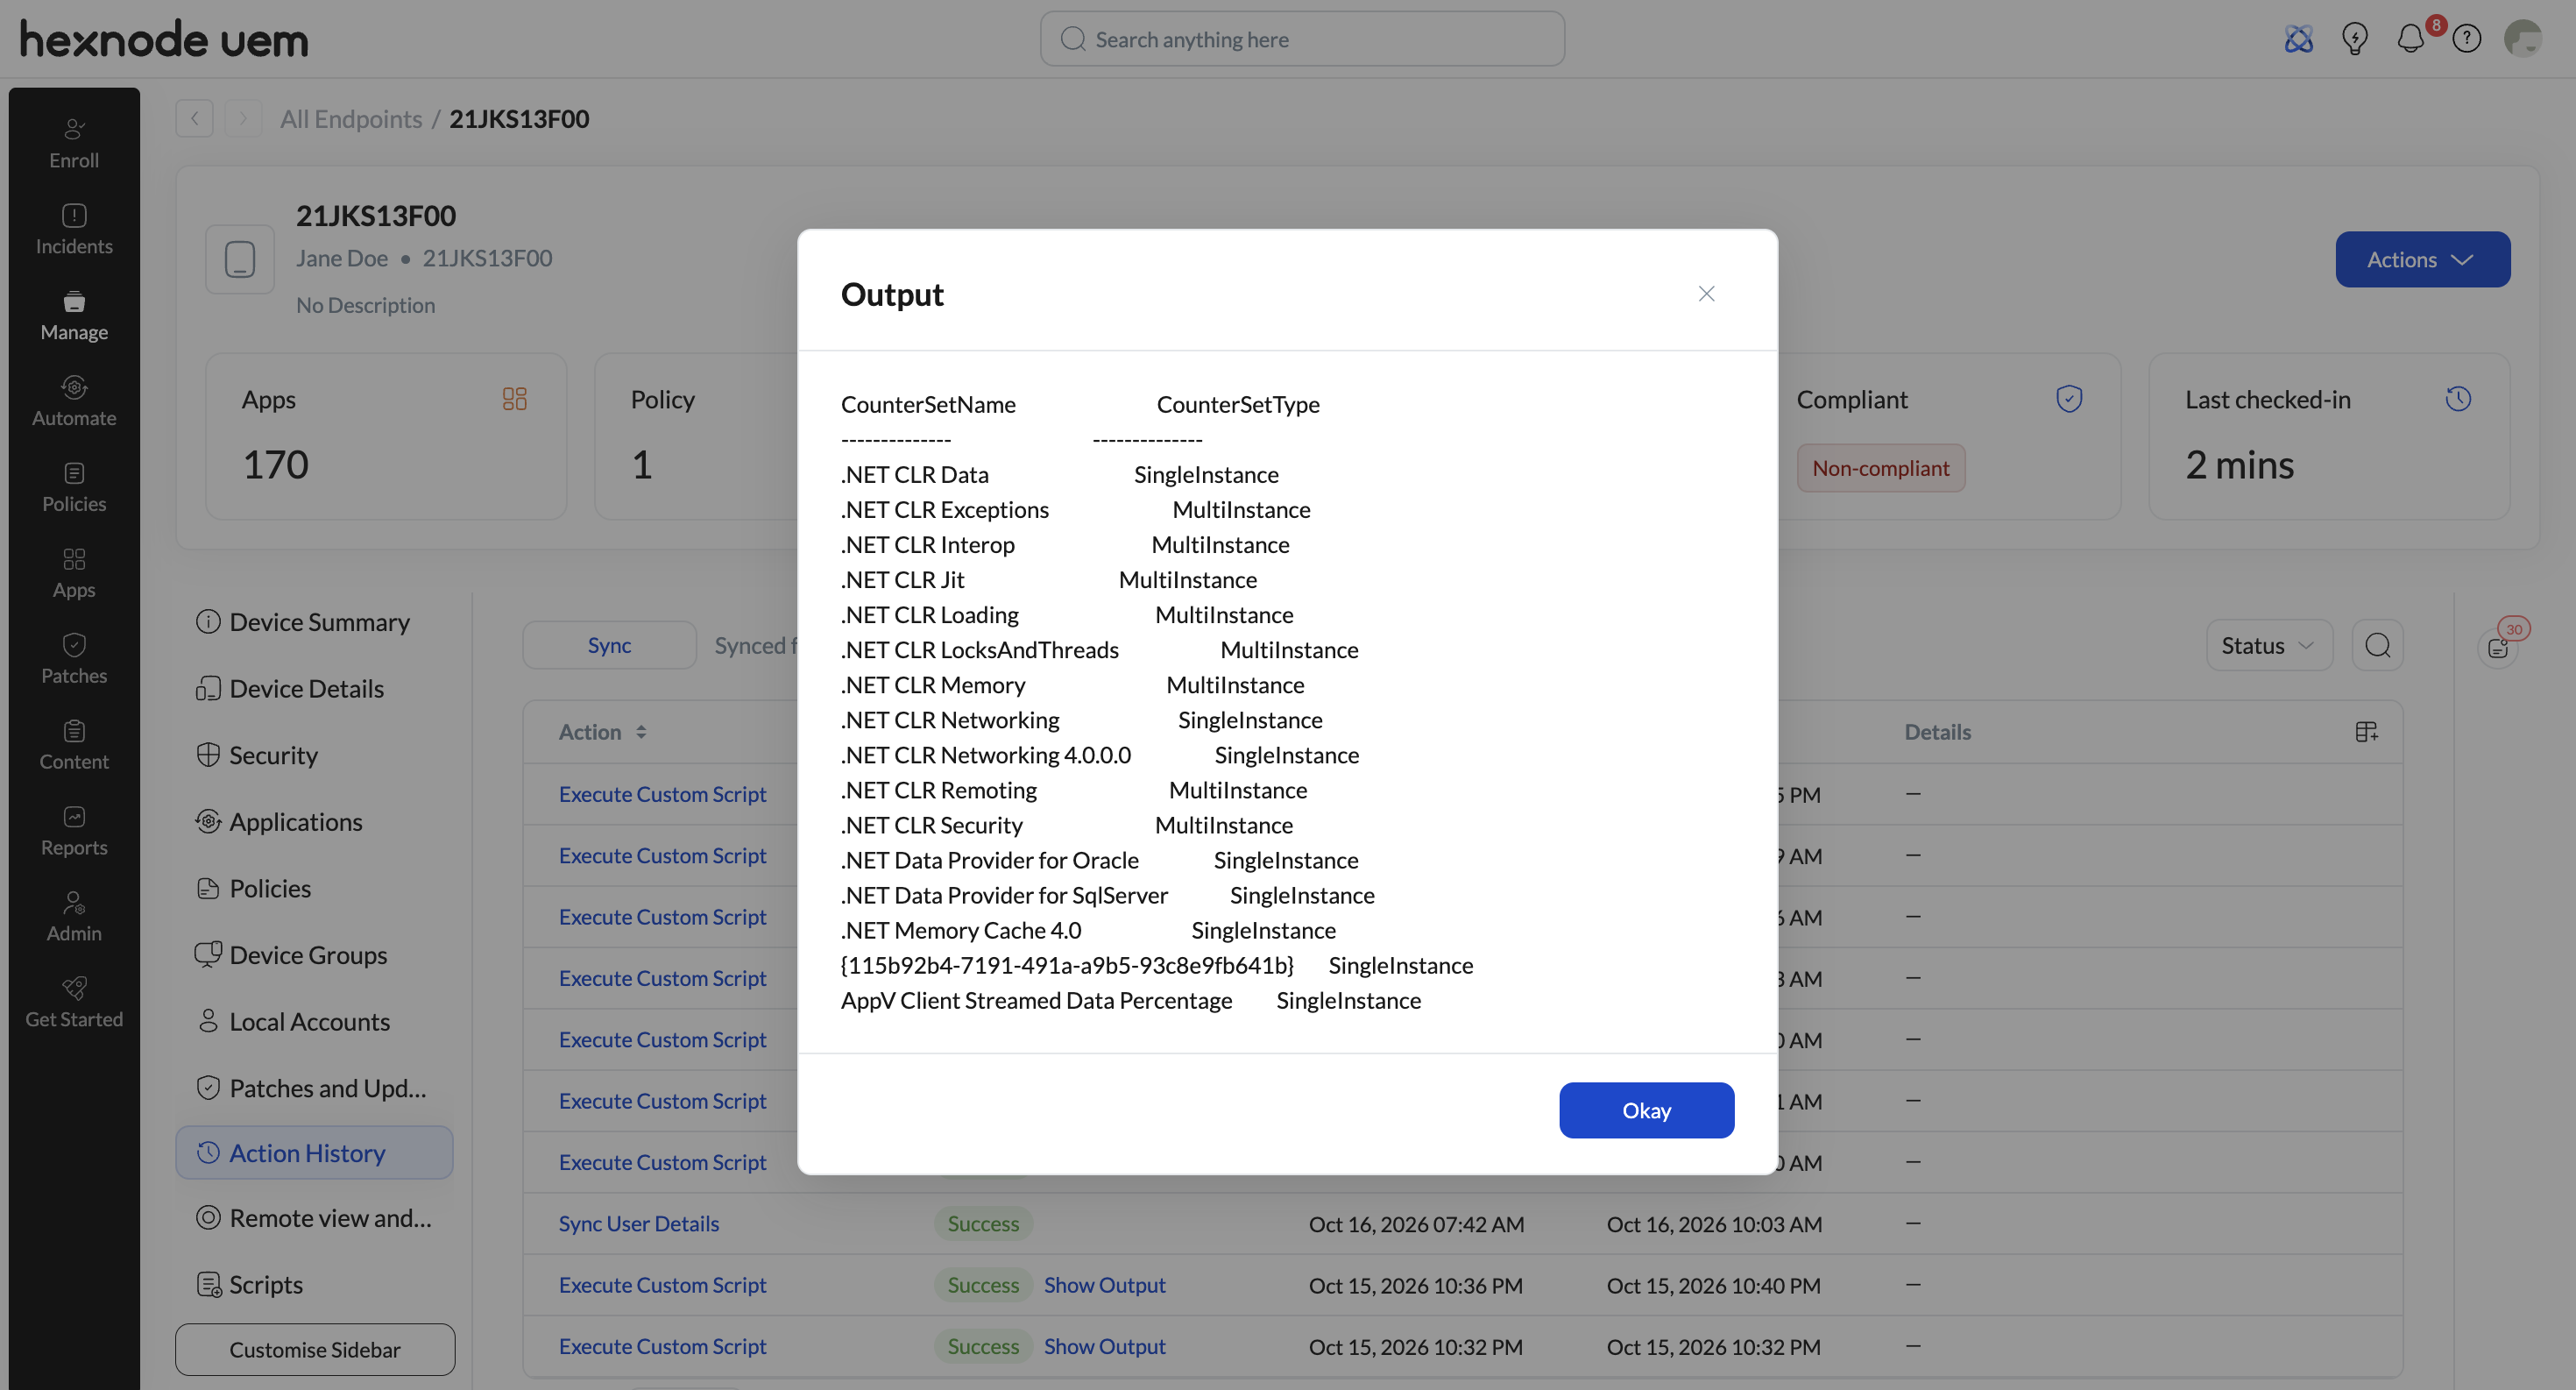
Execute the following script through Hexnode UEM to retrieve all available performance counter sets sorted alphabetically and formatted into a clean, readable table.
|
1 2 3 4 |
Get-Counter -ListSet * | Sort-Object -Property CounterSetName | Format-Table CounterSetName, CounterSetType -AutoSize | Out-String -Width 300 |
How the script works:
| Component | Function |
|---|---|
| Sort-Object | Cmdlet that sorts the retrieved counter sets. |
| -Property CounterSetName | Parameter that specifies the property used to sort the items, ordering the categories alphabetically by CounterSetName. |
| Format-Table CounterSetName, CounterSetType | The Format-Table cmdlet formats the results into a table displaying two specific properties:
|
| -AutoSize | Parameter that adjusts the column widths to fit the length of the text, preventing long names from being truncated. |
| Out-String | Cmdlet that converts the formatted table output into plain text strings. |
| -Width | Parameter that sets the line width to prevent long counter set names from wrapping or cutting off in the Hexnode UEM portal. |
| 300 | Value that sets the line display width to 300 characters. This can be adjusted as needed. |
When to use the script:
Admins can deploy this script to view all available performance counter categories on a Windows device in alphabetical order and identify whether each counter set uses SingleInstance or MultiInstance before configuring targeted performance queries.
5. Fetch formatted path names using the Paths property
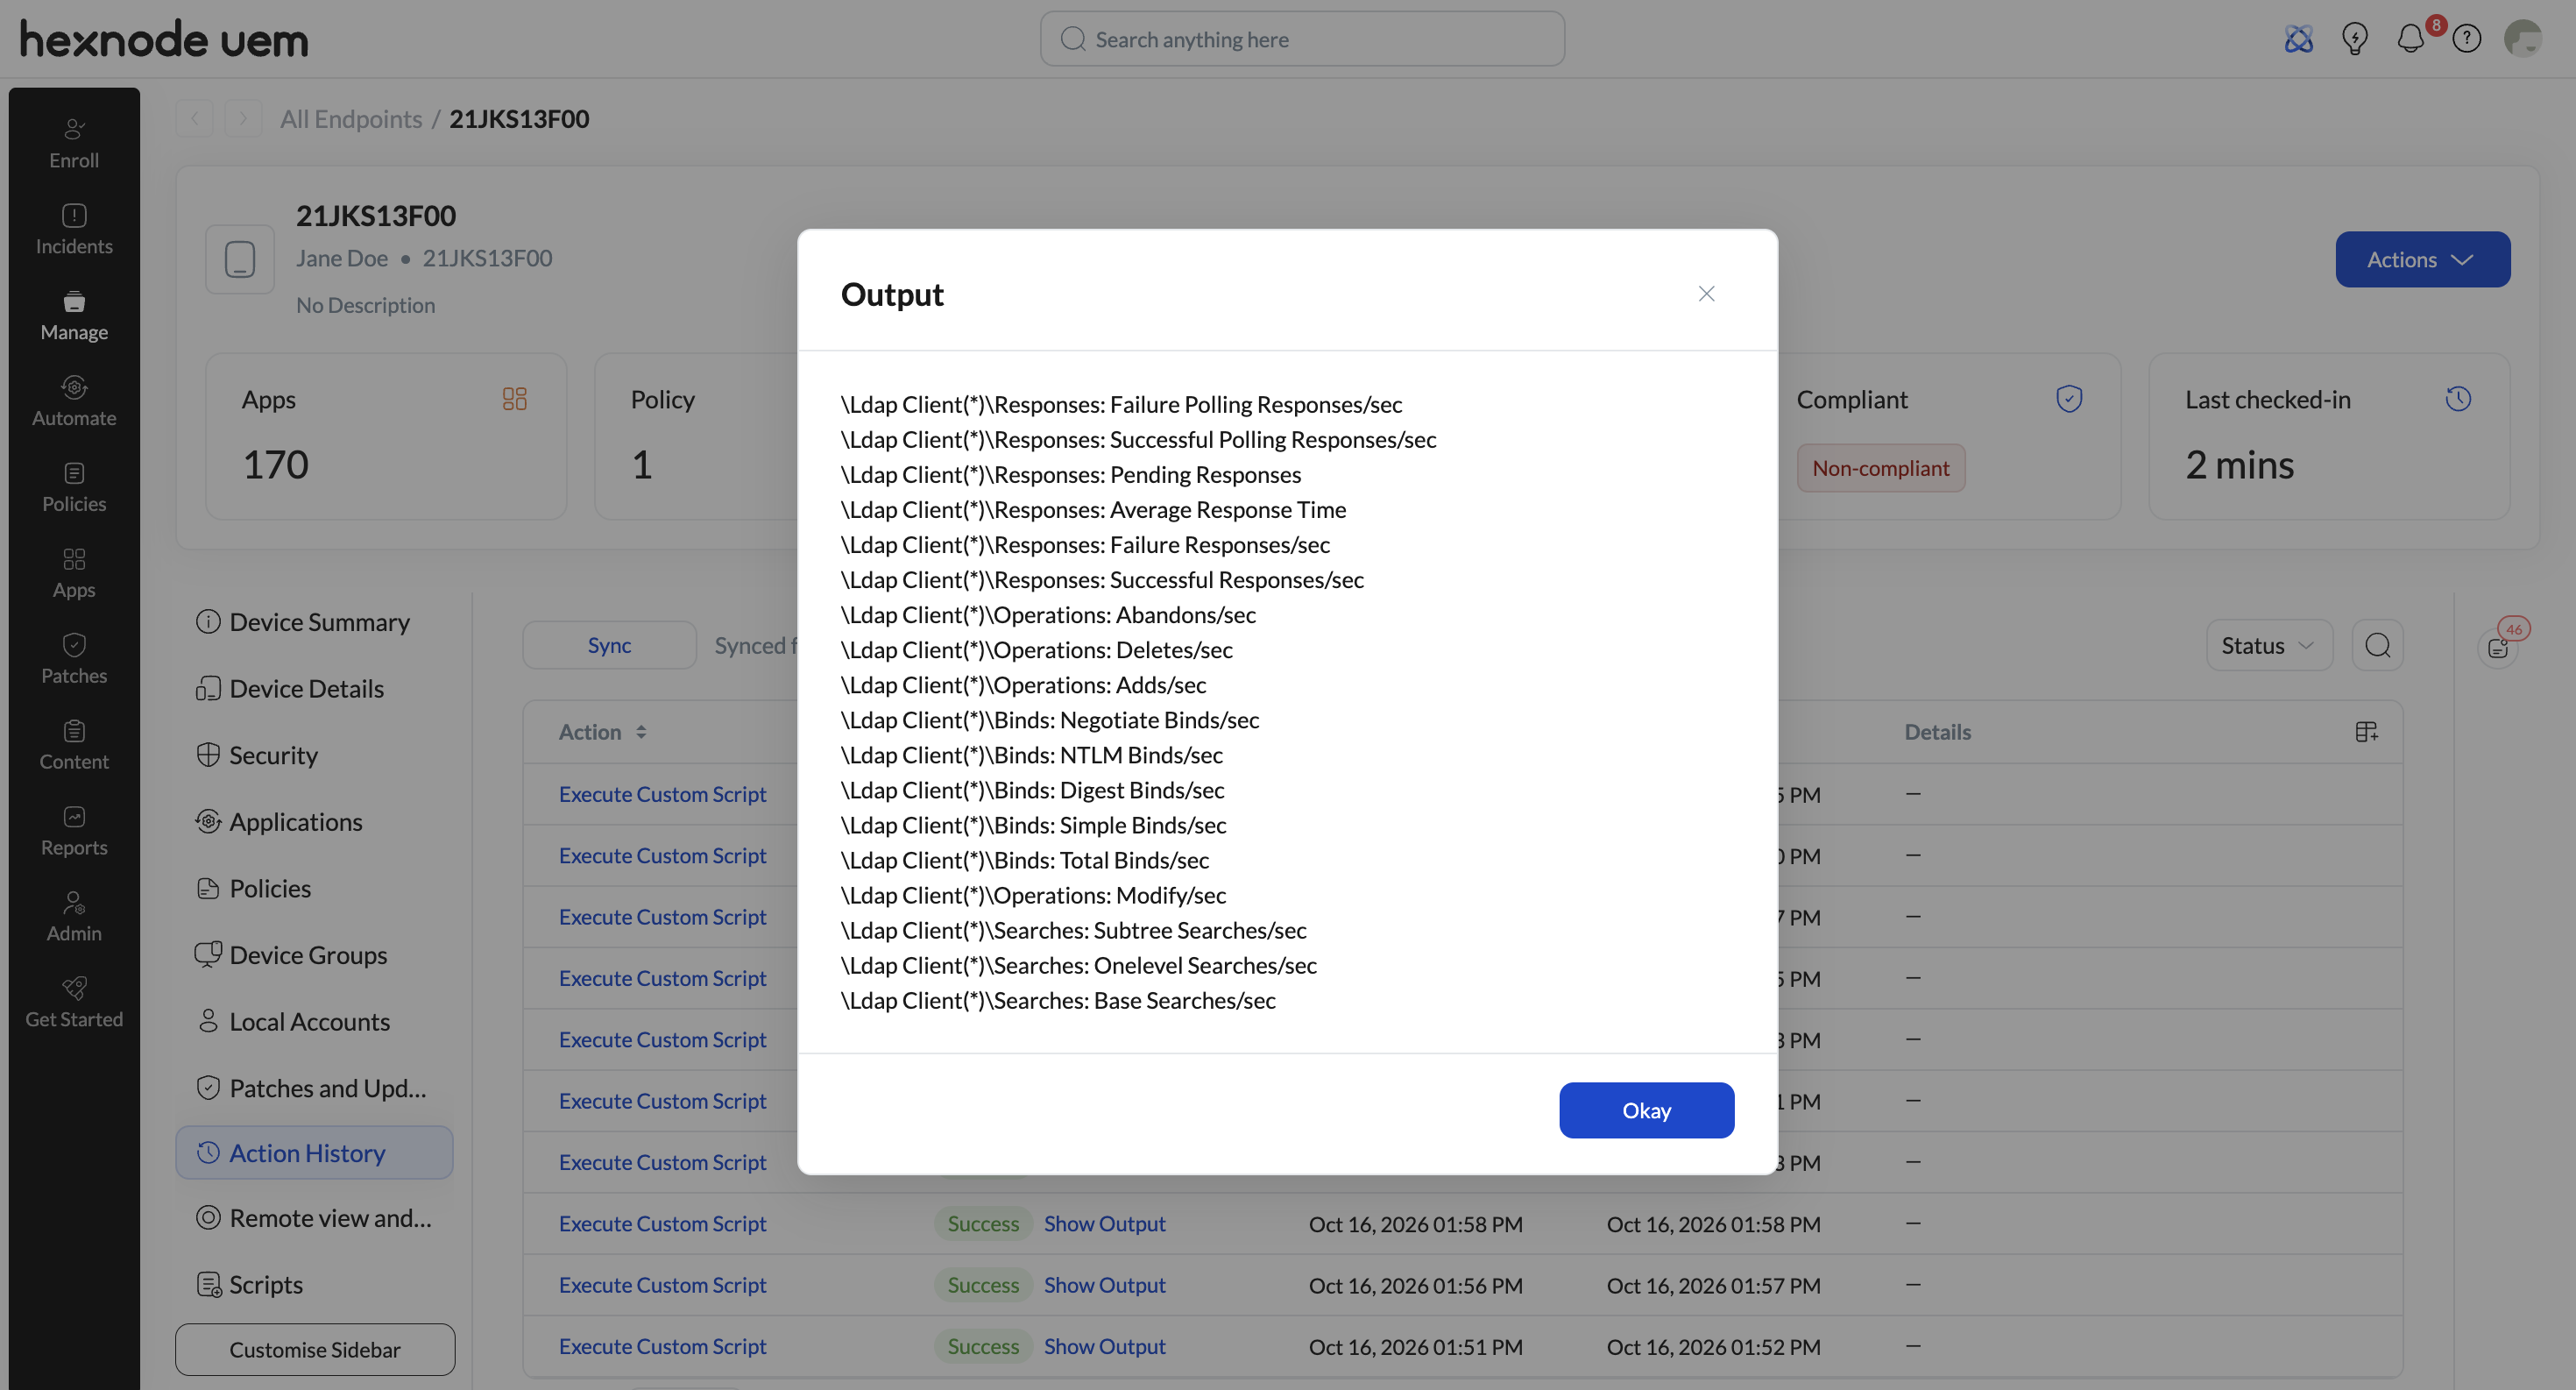
Deploy the following PowerShell script through Hexnode UEM to retrieve the standard metric path templates listed in the .Paths property of a specified performance counter set.
Syntax:
|
1 |
(Get-Counter -ListSet "<CounterSetName>").Paths |
How the script works:
| Component | Function |
|---|---|
| “<CounterSetName>” | Placeholder to be replaced with the exact category name (e.g., “Ldap Client”). |
| .Paths | Property that extracts the canonical path templates for every metric in the counter set. For multi-instance sets, these paths include a wildcard placeholder (*) instead of specific system instances. |
When to use the script:
Admins can deploy this script to retrieve valid counter path templates for a specific service or subsystem, such as LDAP, Active Directory, or DNS. The .Paths property returns the paths in the correct format, helping admins build targeted monitoring scripts without errors caused by incorrectly entered counter names or path syntax.
Example:
The following script retrieves all canonical counter path templates under the Ldap Client category, helping admins identify the exact metric paths for auditing domain controller lookup latency and authentication requests:
|
1 |
(Get-Counter -ListSet "Ldap Client").Paths |
6. Fetch formatted path names using the PathsWithInstances property
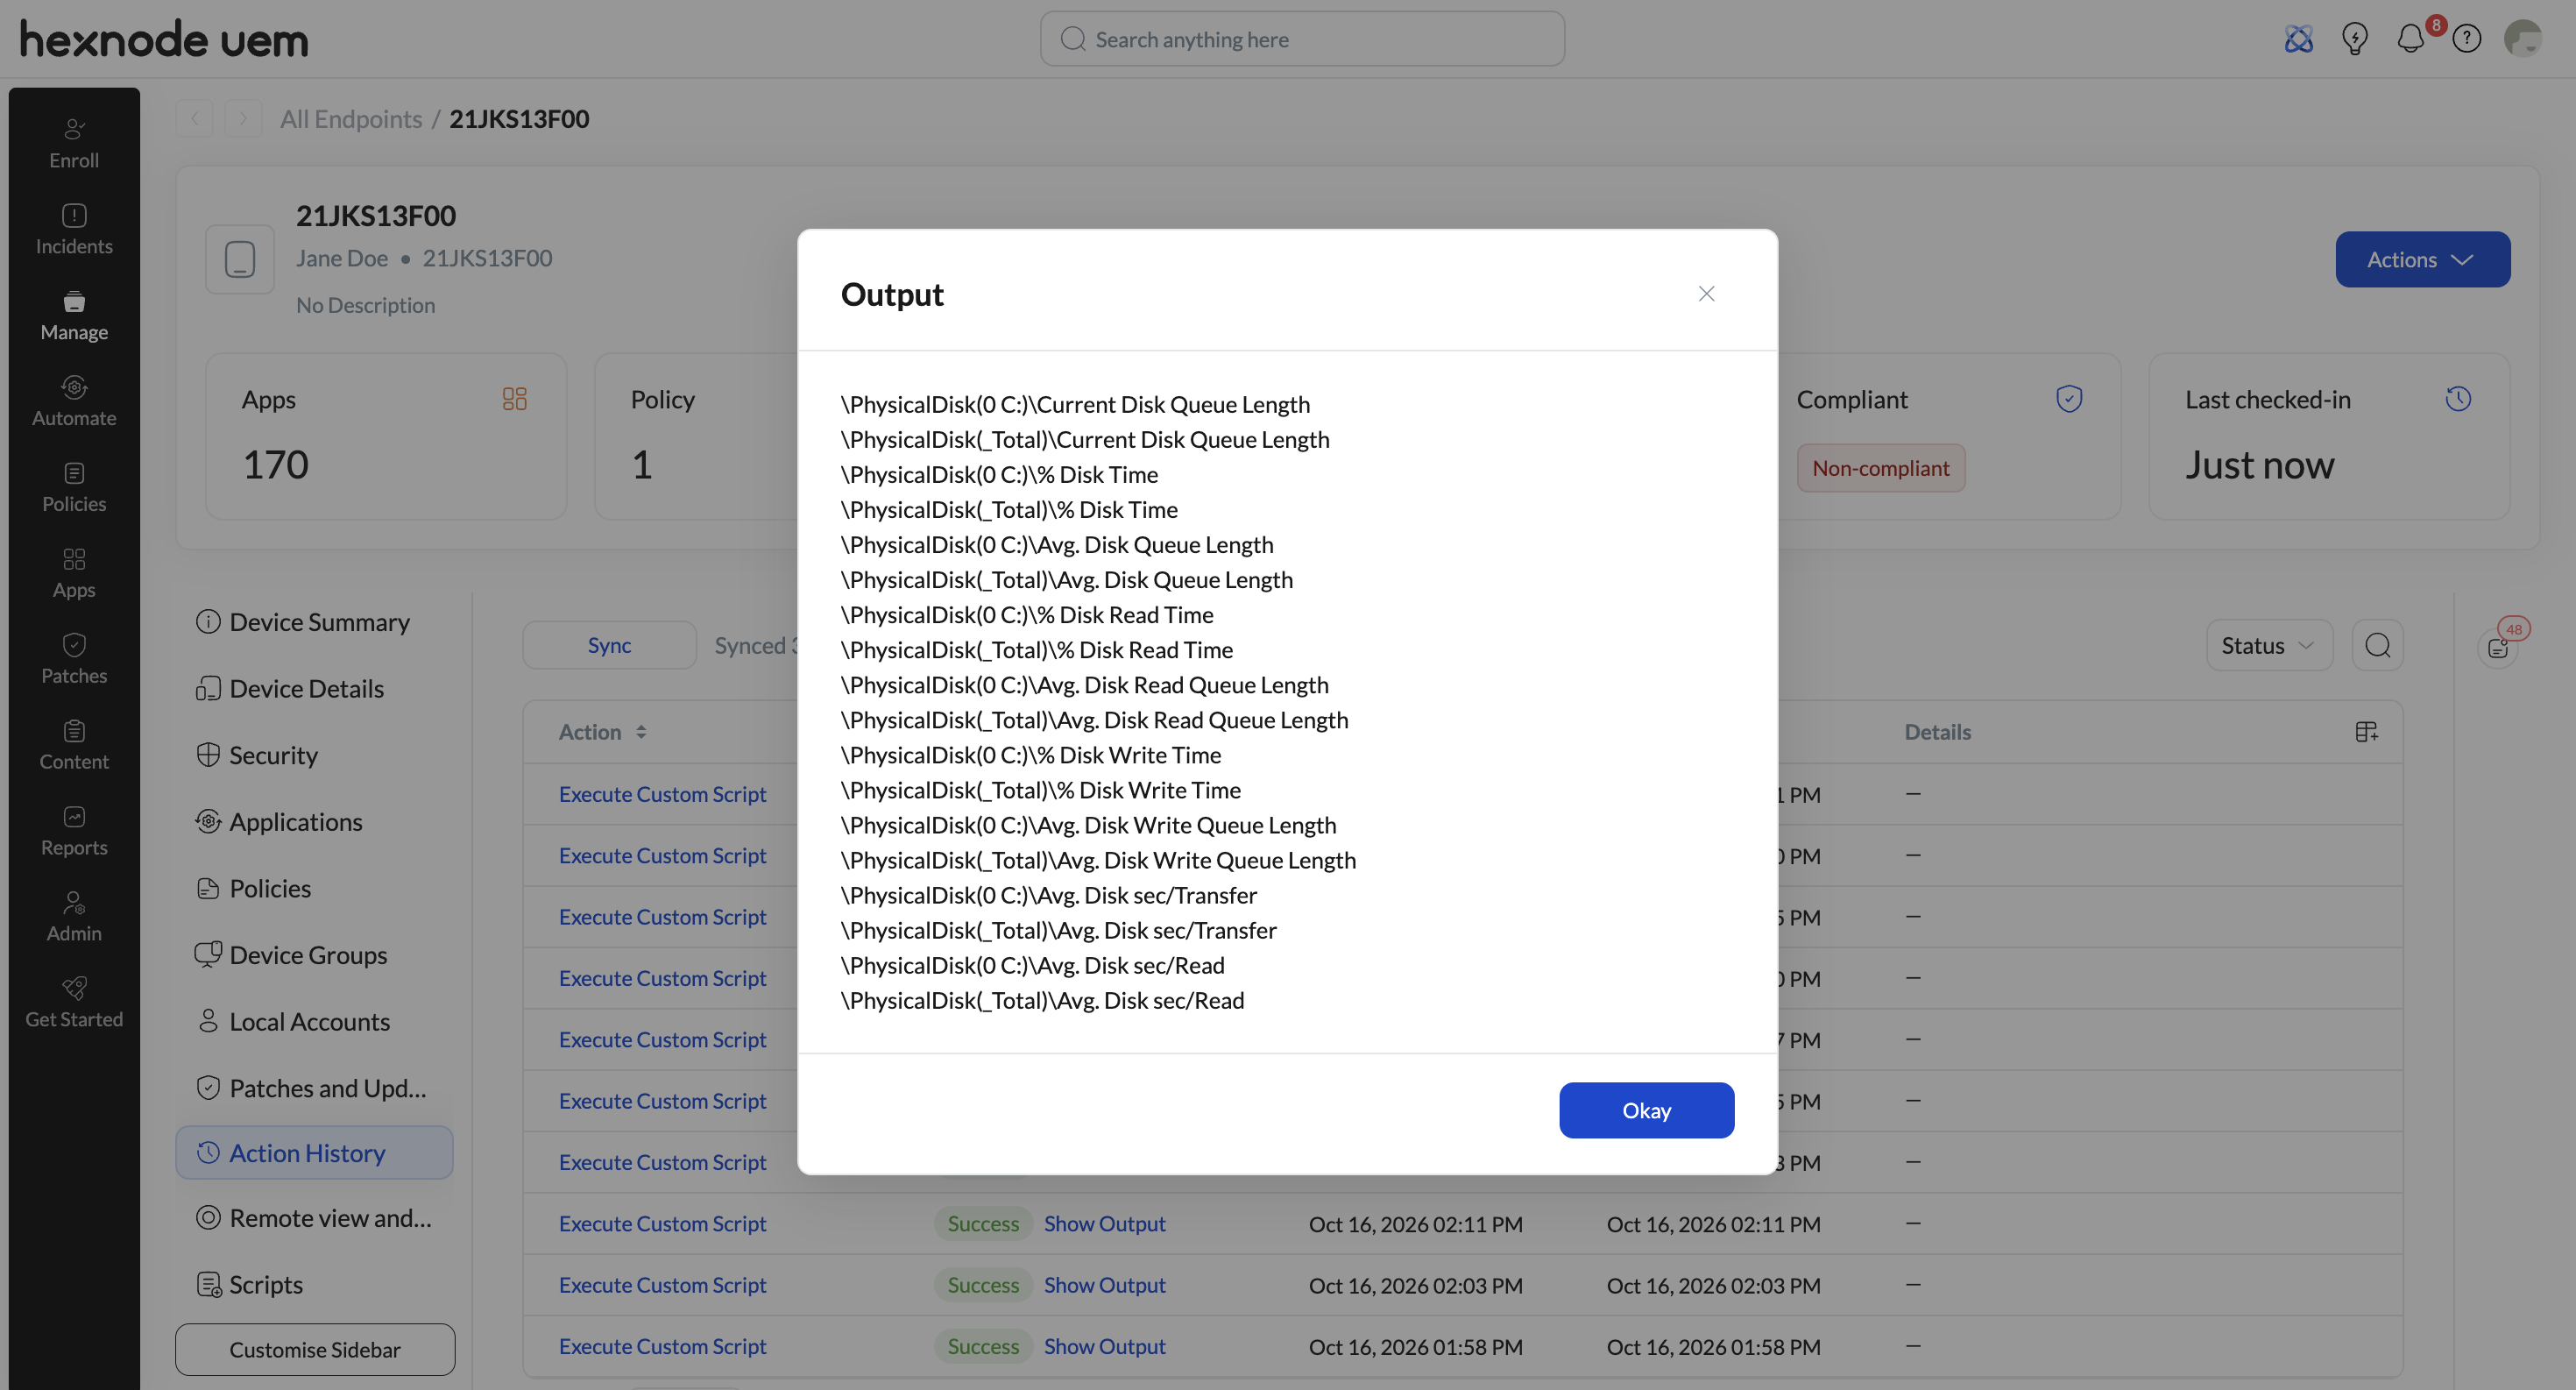
Execute the following PowerShell script via Hexnode UEM to retrieve counter paths mapped to the active hardware and process instances currently running on the endpoint (such as specific disk partitions, CPU cores, or background processes).
While the .Paths property returns canonical counter path templates containing a wildcard (*), the .PathsWithInstances property resolves those templates into live system instance identifiers (such as 0 C: and _Total). This allows administrators to extract the exact path strings needed to target specific resources without guessing disk index numbers or core IDs.
Syntax:
|
1 |
(Get-Counter -ListSet "<CounterSetName>").PathsWithInstances |
How the script works:
| Component | Function |
|---|---|
| “<CounterSetName>” | Placeholder to be replaced with the exact category name (e.g., “PhysicalDisk”). |
| .PathsWithInstances | Property that returns the counter paths for every metric in the selected category, resolved to the active hardware, volume, or process instances on the device (such as disk partitions like 0 C: or logical CPU core indices). |
When to use the script:
Admins can run this script when troubleshooting problems on a specific drive—such as slow file transfers, freezing disks, or high disk queue lengths. If a device has multiple hard drives, this script shows the exact path for each drive (like 0 C:), allowing admins to copy and use that path to monitor only the drive experiencing issues.
Example:
The following script retrieves all counter paths for the PhysicalDisk category, showing the exact paths for the C: drive (0 C:) and the combined total (_Total).
|
1 |
(Get-Counter -ListSet "PhysicalDisk").PathsWithInstances |
7. Fetch a single value for each counter in a counter set
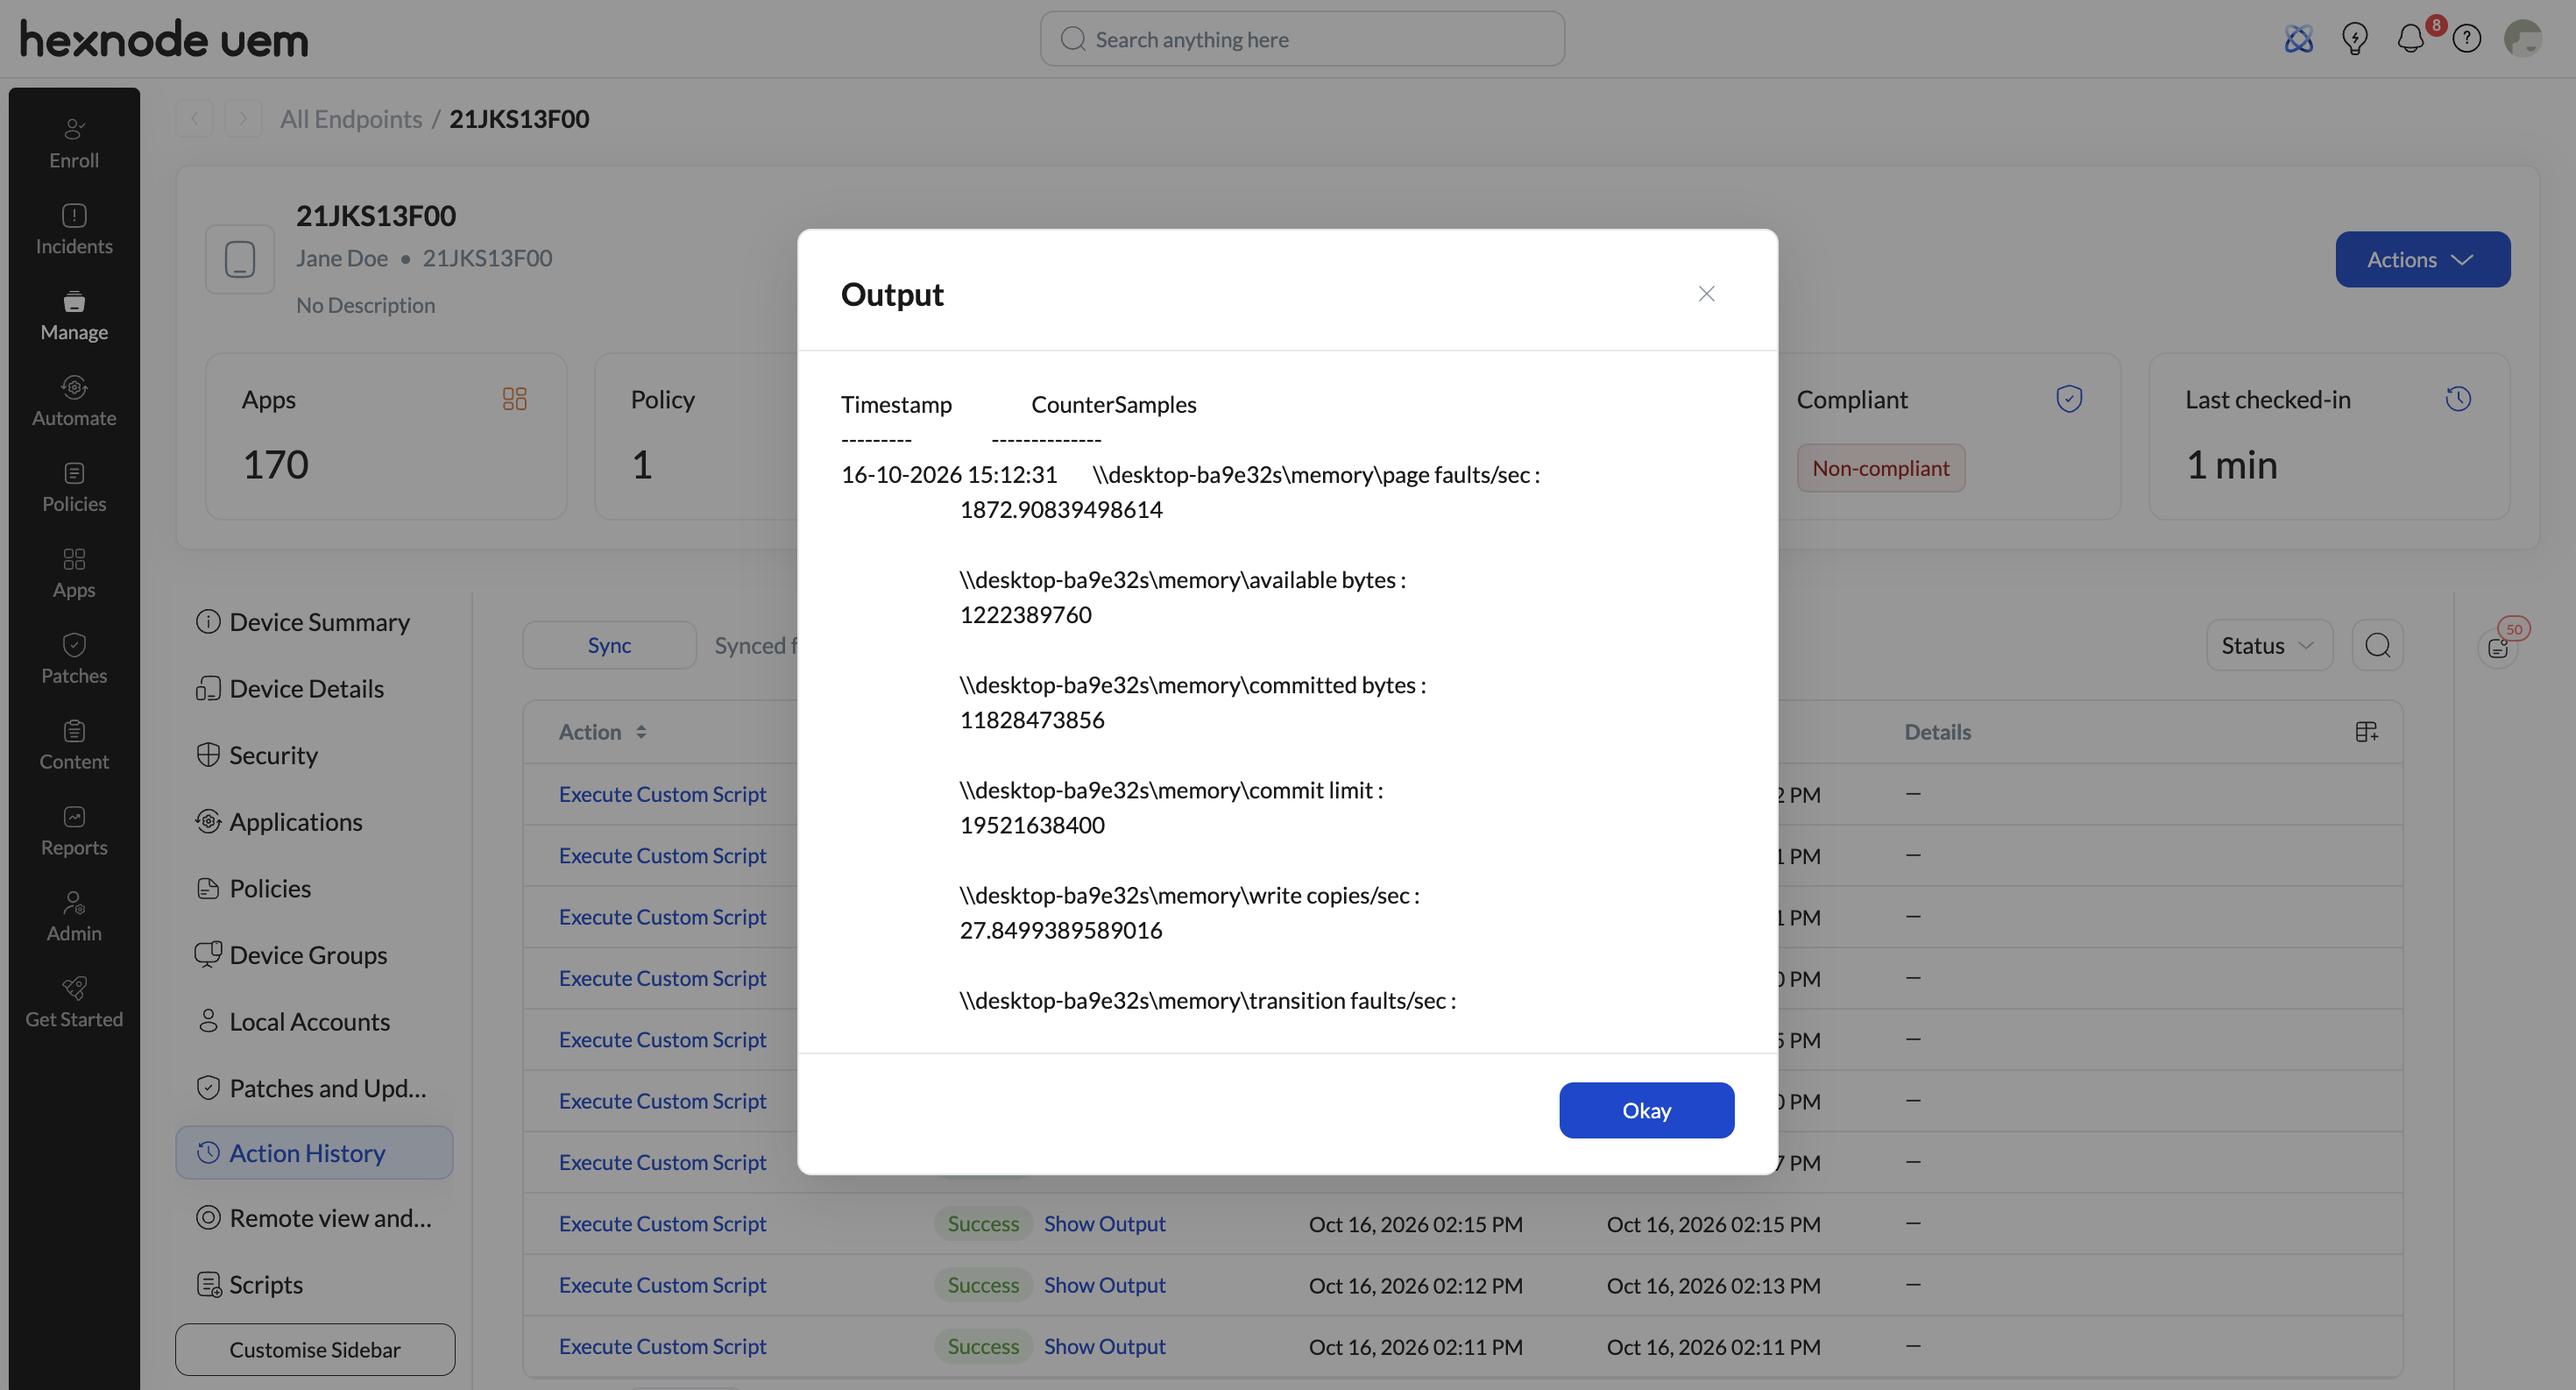
Execute the following PowerShell script through Hexnode UEM to capture an instantaneous baseline snapshot of all metric values within a target single-instance counter set.
Syntax:
|
1 2 |
$Counters = (Get-Counter -ListSet "<CounterSetName>").Paths Get-Counter -Counter $Counters |
How the script works:
| Component | Function |
|---|---|
| “<CounterSetName>” | Placeholder to be replaced with the exact category name (e.g., “Memory”). |
| .Paths | Object property that extracts the canonical path strings for every performance metric defined within the target category. |
| $Counters | Variable that stores the retrieved list of counter paths. |
| -Counter | Accepts the array of path strings stored in $Counters and instructs Get-Counter to capture a single, point-in-time sample snapshot for each specified metric. |
When to use the script:
Admins can use this script to retrieve all metrics within a single-instance counter set, such as Memory or System, in one execution. Viewing all related counter values together provides a snapshot of the subsystem’s current state, helping administrators identify unusual resource usage without querying each metric separately.
Example:
The following script retrieves all canonical counter paths under the Memory category and collects a single reading for each metric. This allows administrators to examine physical memory availability, commit limits, and memory pool allocations in a single execution:
|
1 2 |
$MemCounters = (Get-Counter -ListSet "Memory").Paths Get-Counter -Counter $MemCounters |
8. Display an object’s property value
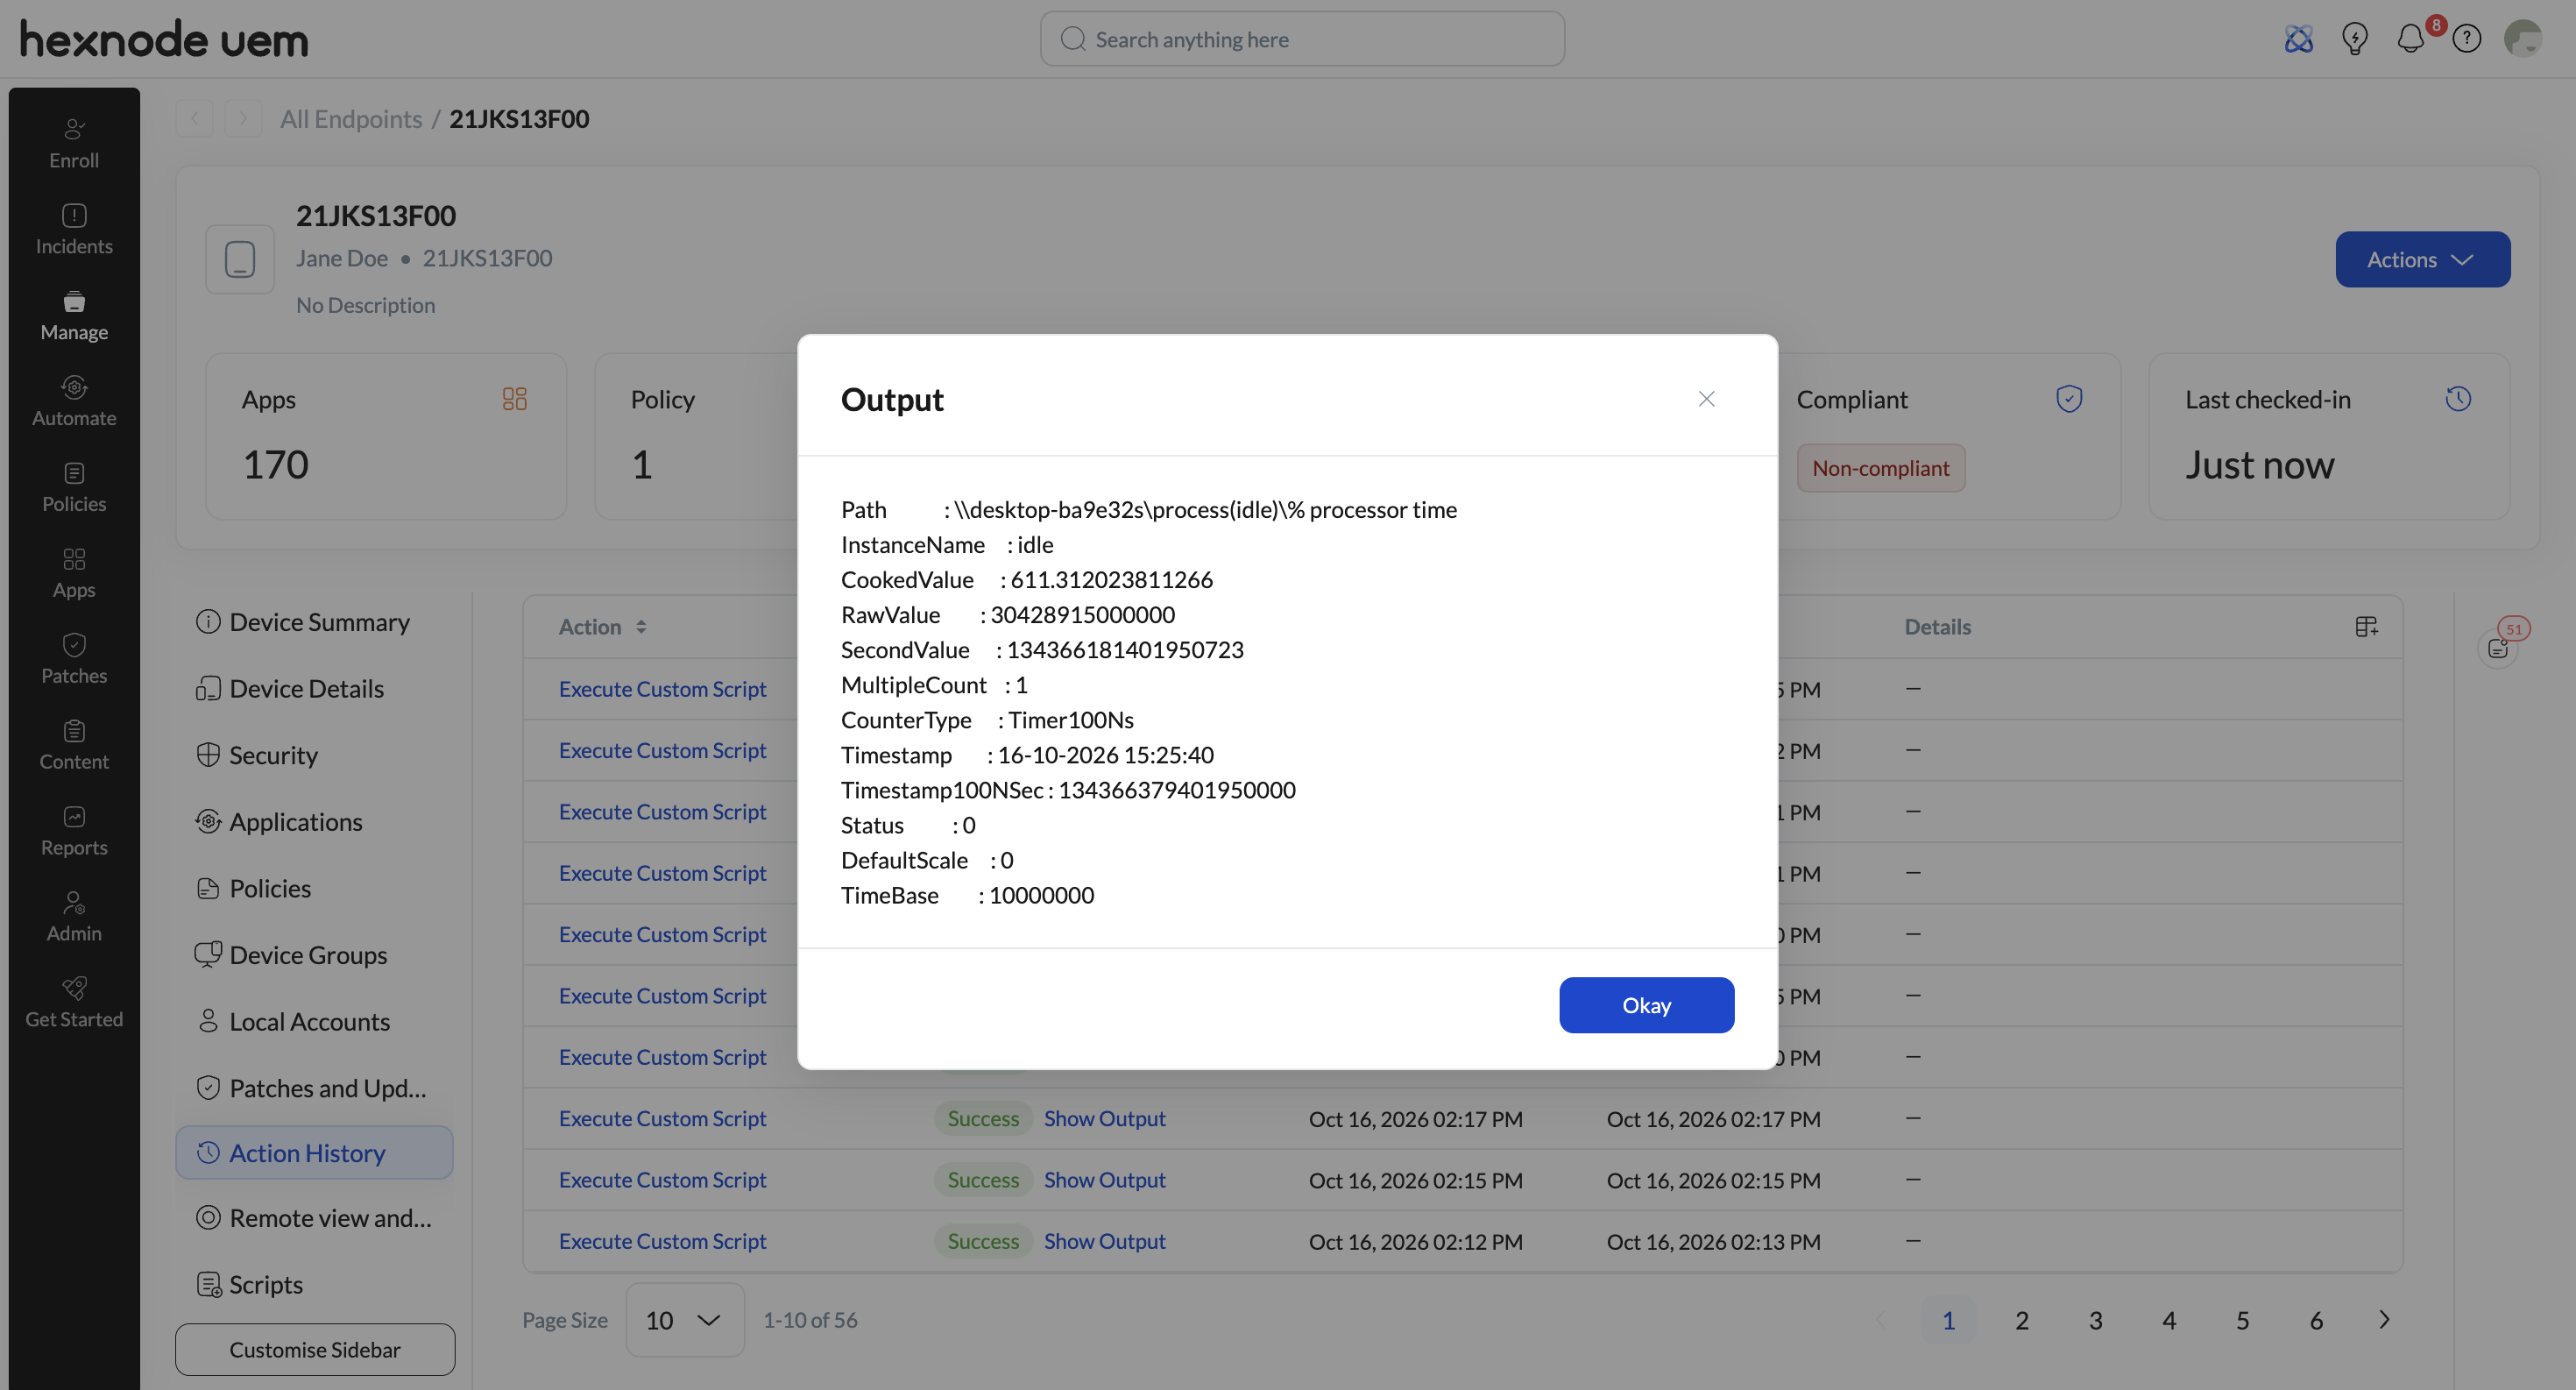
Execute the following PowerShell script through Hexnode UEM to capture a performance counter reading and expand all of its underlying property values (such as Path, InstanceName, CookedValue, RawValue, Timestamp, and status codes) into a detailed list view.
|
1 2 3 |
$Counter = "\Process(Idle)\% Processor Time" $Data = Get-Counter -Counter $Counter $Data.CounterSamples | Format-List -Property * |
How the script works:
| Component | Function |
|---|---|
| $Counter | Variable that stores the target metric path (\Process(Idle)\% Processor Time), a built-in counter that measures the percentage of time the processor is idle. This can be replaced with any metric path to inspect. |
| $Data | Stores the performance counter data returned by Get-Counter, including the collected counter samples and related metadata. |
| -Counter | Accepts the array of path strings stored in $Counters and instructs Get-Counter to capture a single, point-in-time sample snapshot for each specified metric. |
| $Data.CounterSamples | Property that extracts the detailed sample data from the stored object. |
| Format-List | Cmdlet that displays the output in a vertical list instead of a table. |
| -Property | Parameter that specifies which properties to show. |
| * | Wildcard character specifying that every available property and value should be displayed (including Path, InstanceName, CookedValue, RawValue, Timestamp, and Status). |
When to use the script:
Admins can use this script to investigate metric anomalies, verify the health of Performance Data Helper (PDH) providers, or identify the properties available for use in automation scripts. By displaying the underlying object properties and diagnostic metadata, the script helps admins check whether a counter is returning valid measurements and identify details such as its status, instance name, and timestamp. It also reveals the exact property names needed to extract specific metric values in custom scripts.
9.Retrieve performance data for a specific processor instance
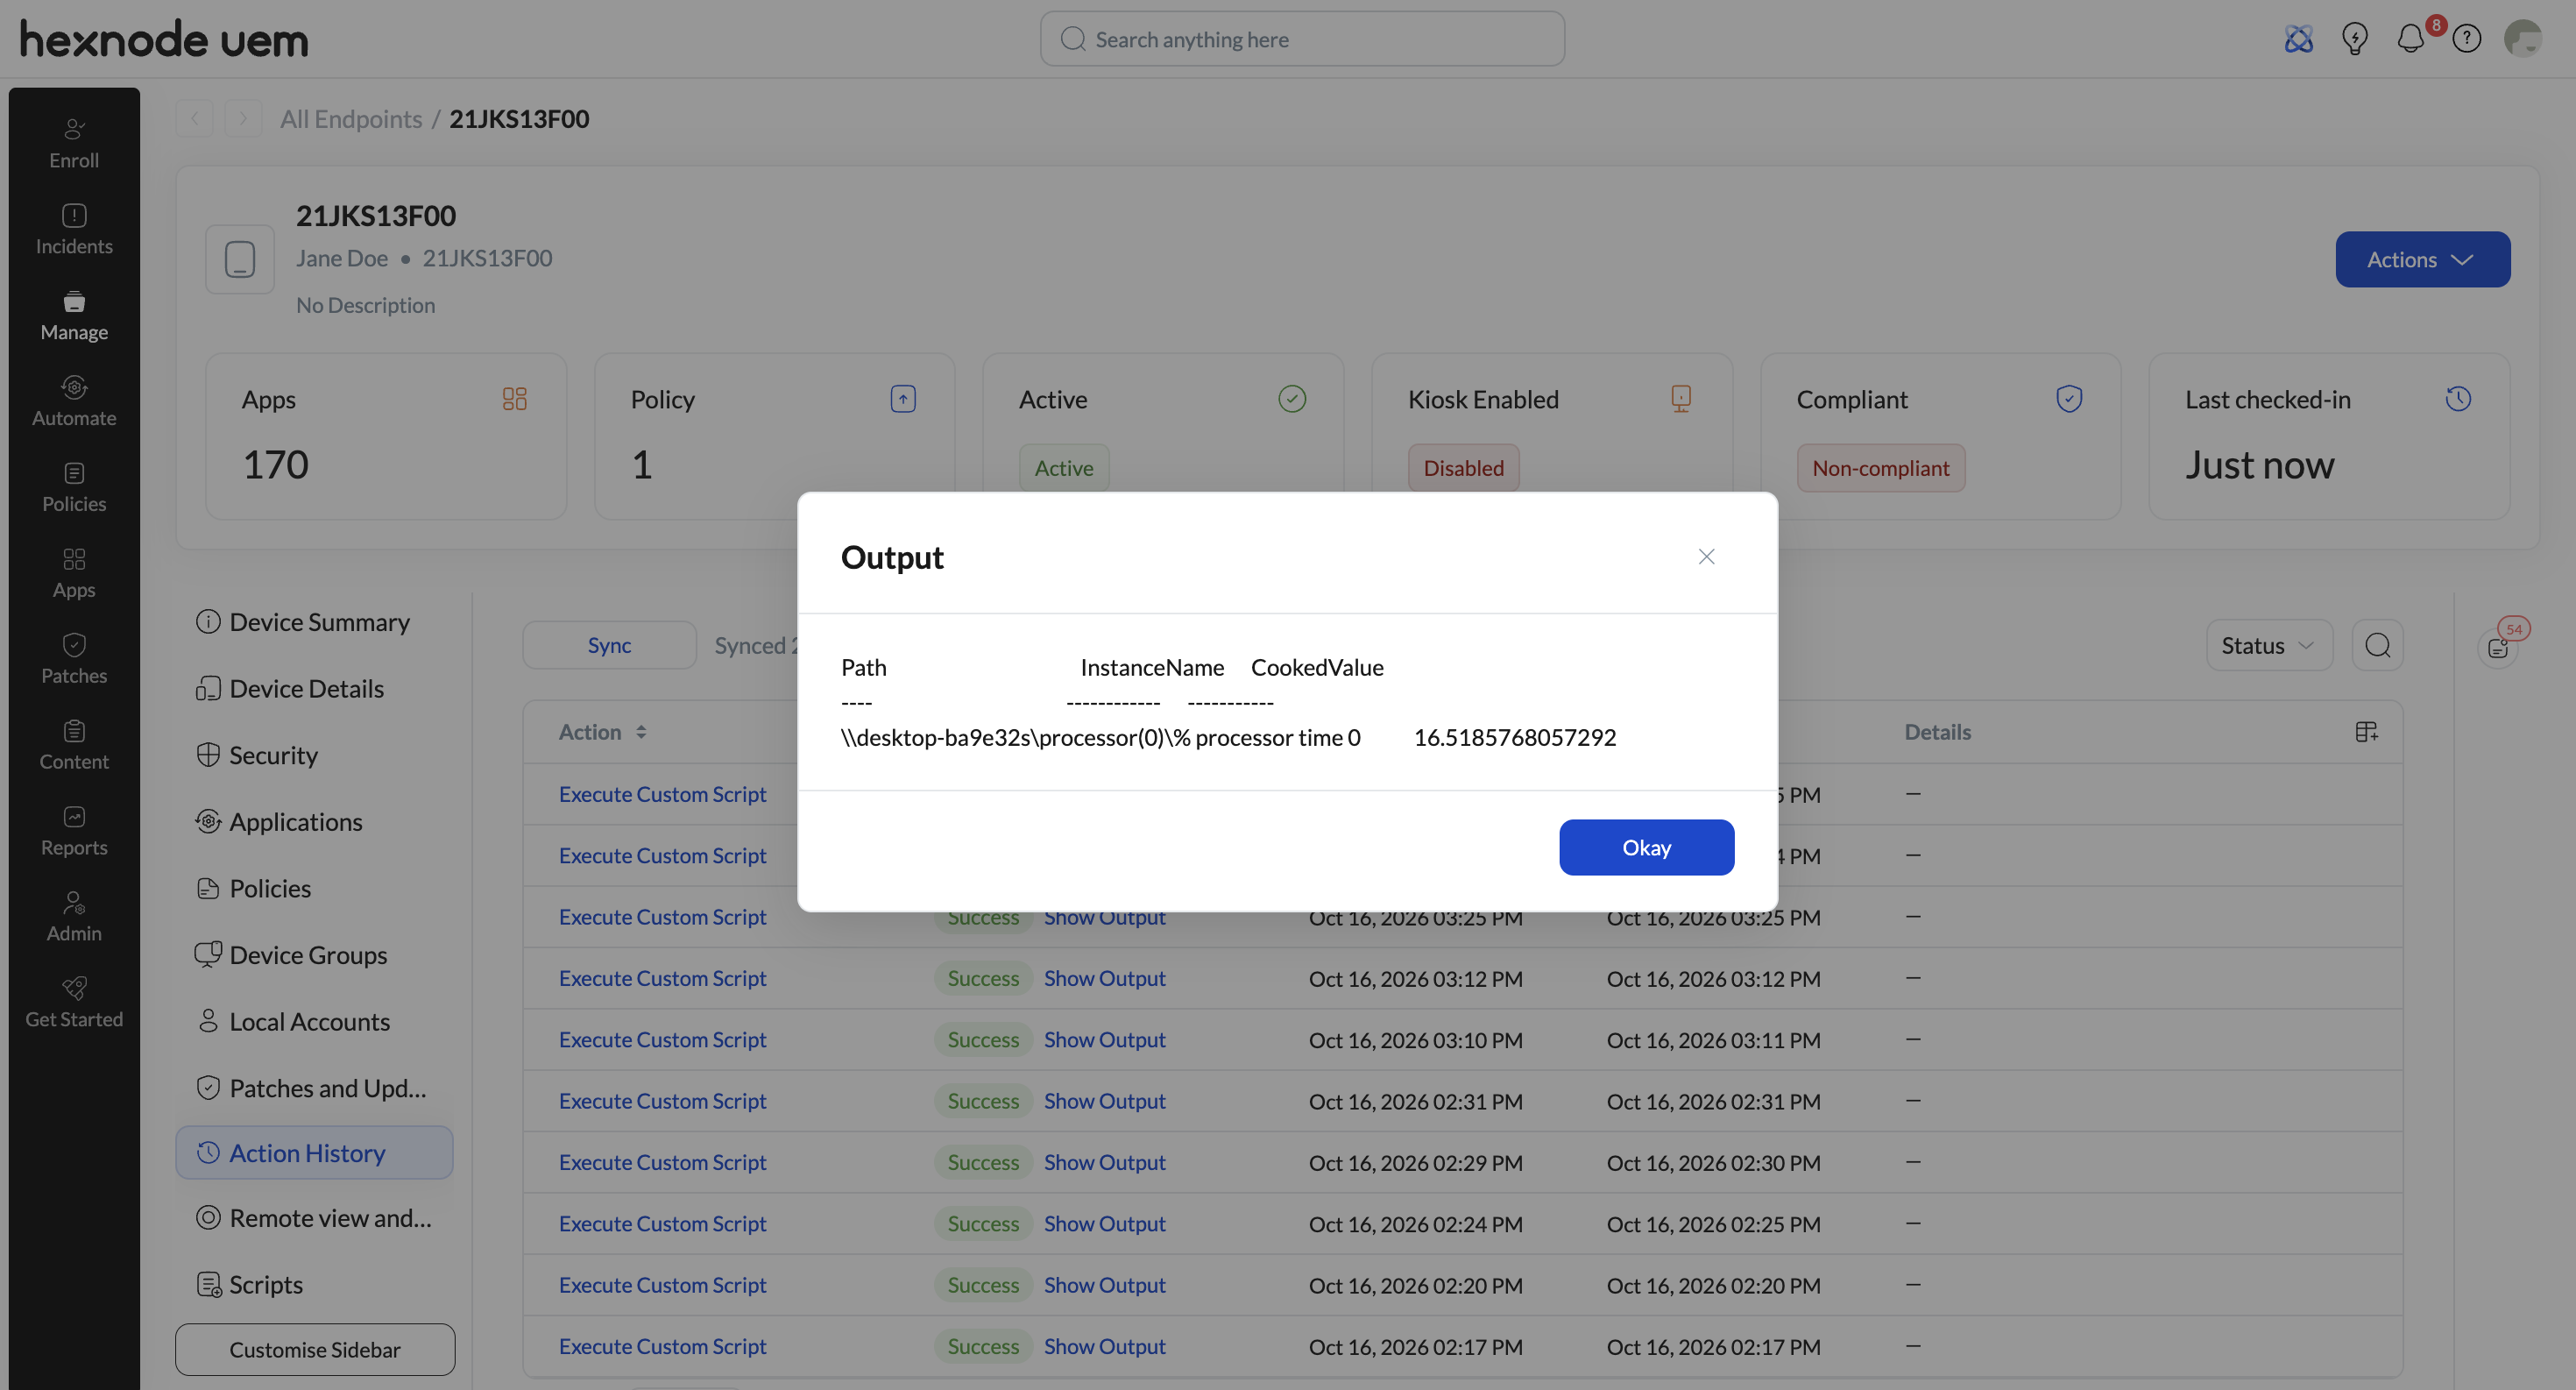
Execute the following PowerShell script through Hexnode UEM to retrieve the processor usage reading for a specific logical processor instance on the target Windows device.
Syntax:
|
1 2 |
$Counter = Get-Counter -Counter "\Processor(<Instance_Number>)\% Processor Time" $Counter.CounterSamples[0] |
How the script works:
| Component | Function |
|---|---|
| \Processor(<Instance_Number>)\% Processor Time | Counter path that specifies the logical processor instance whose CPU usage data is to be retrieved. Replace < Instance_Number> with an available processor instance number on the target device (e.g., 0, 1, 2 etc.). |
| $Counter | Variable that stores the performance counter reading returned by Get-Counter. |
| $Counter.CounterSamples[0] | Property that retrieves the first sample from the CounterSamples array. Since the query targets only one processor instance, it returns the reading for that instance. |
When to use the script:
Administrators can use this script when they need to monitor CPU usage for a particular logical processor instance instead of retrieving readings for all processor instances on the device. This helps admins to inspect individual processor usage without collecting unnecessary counter data.
Example:
The following script retrieves CPU usage data for logical processor instance 0 on the target Windows device:
|
1 2 |
$Counter = Get-Counter -Counter "\Processor(0)\% Processor Time" $Counter.CounterSamples[0] |
10. Filter CPU usage readings by threshold
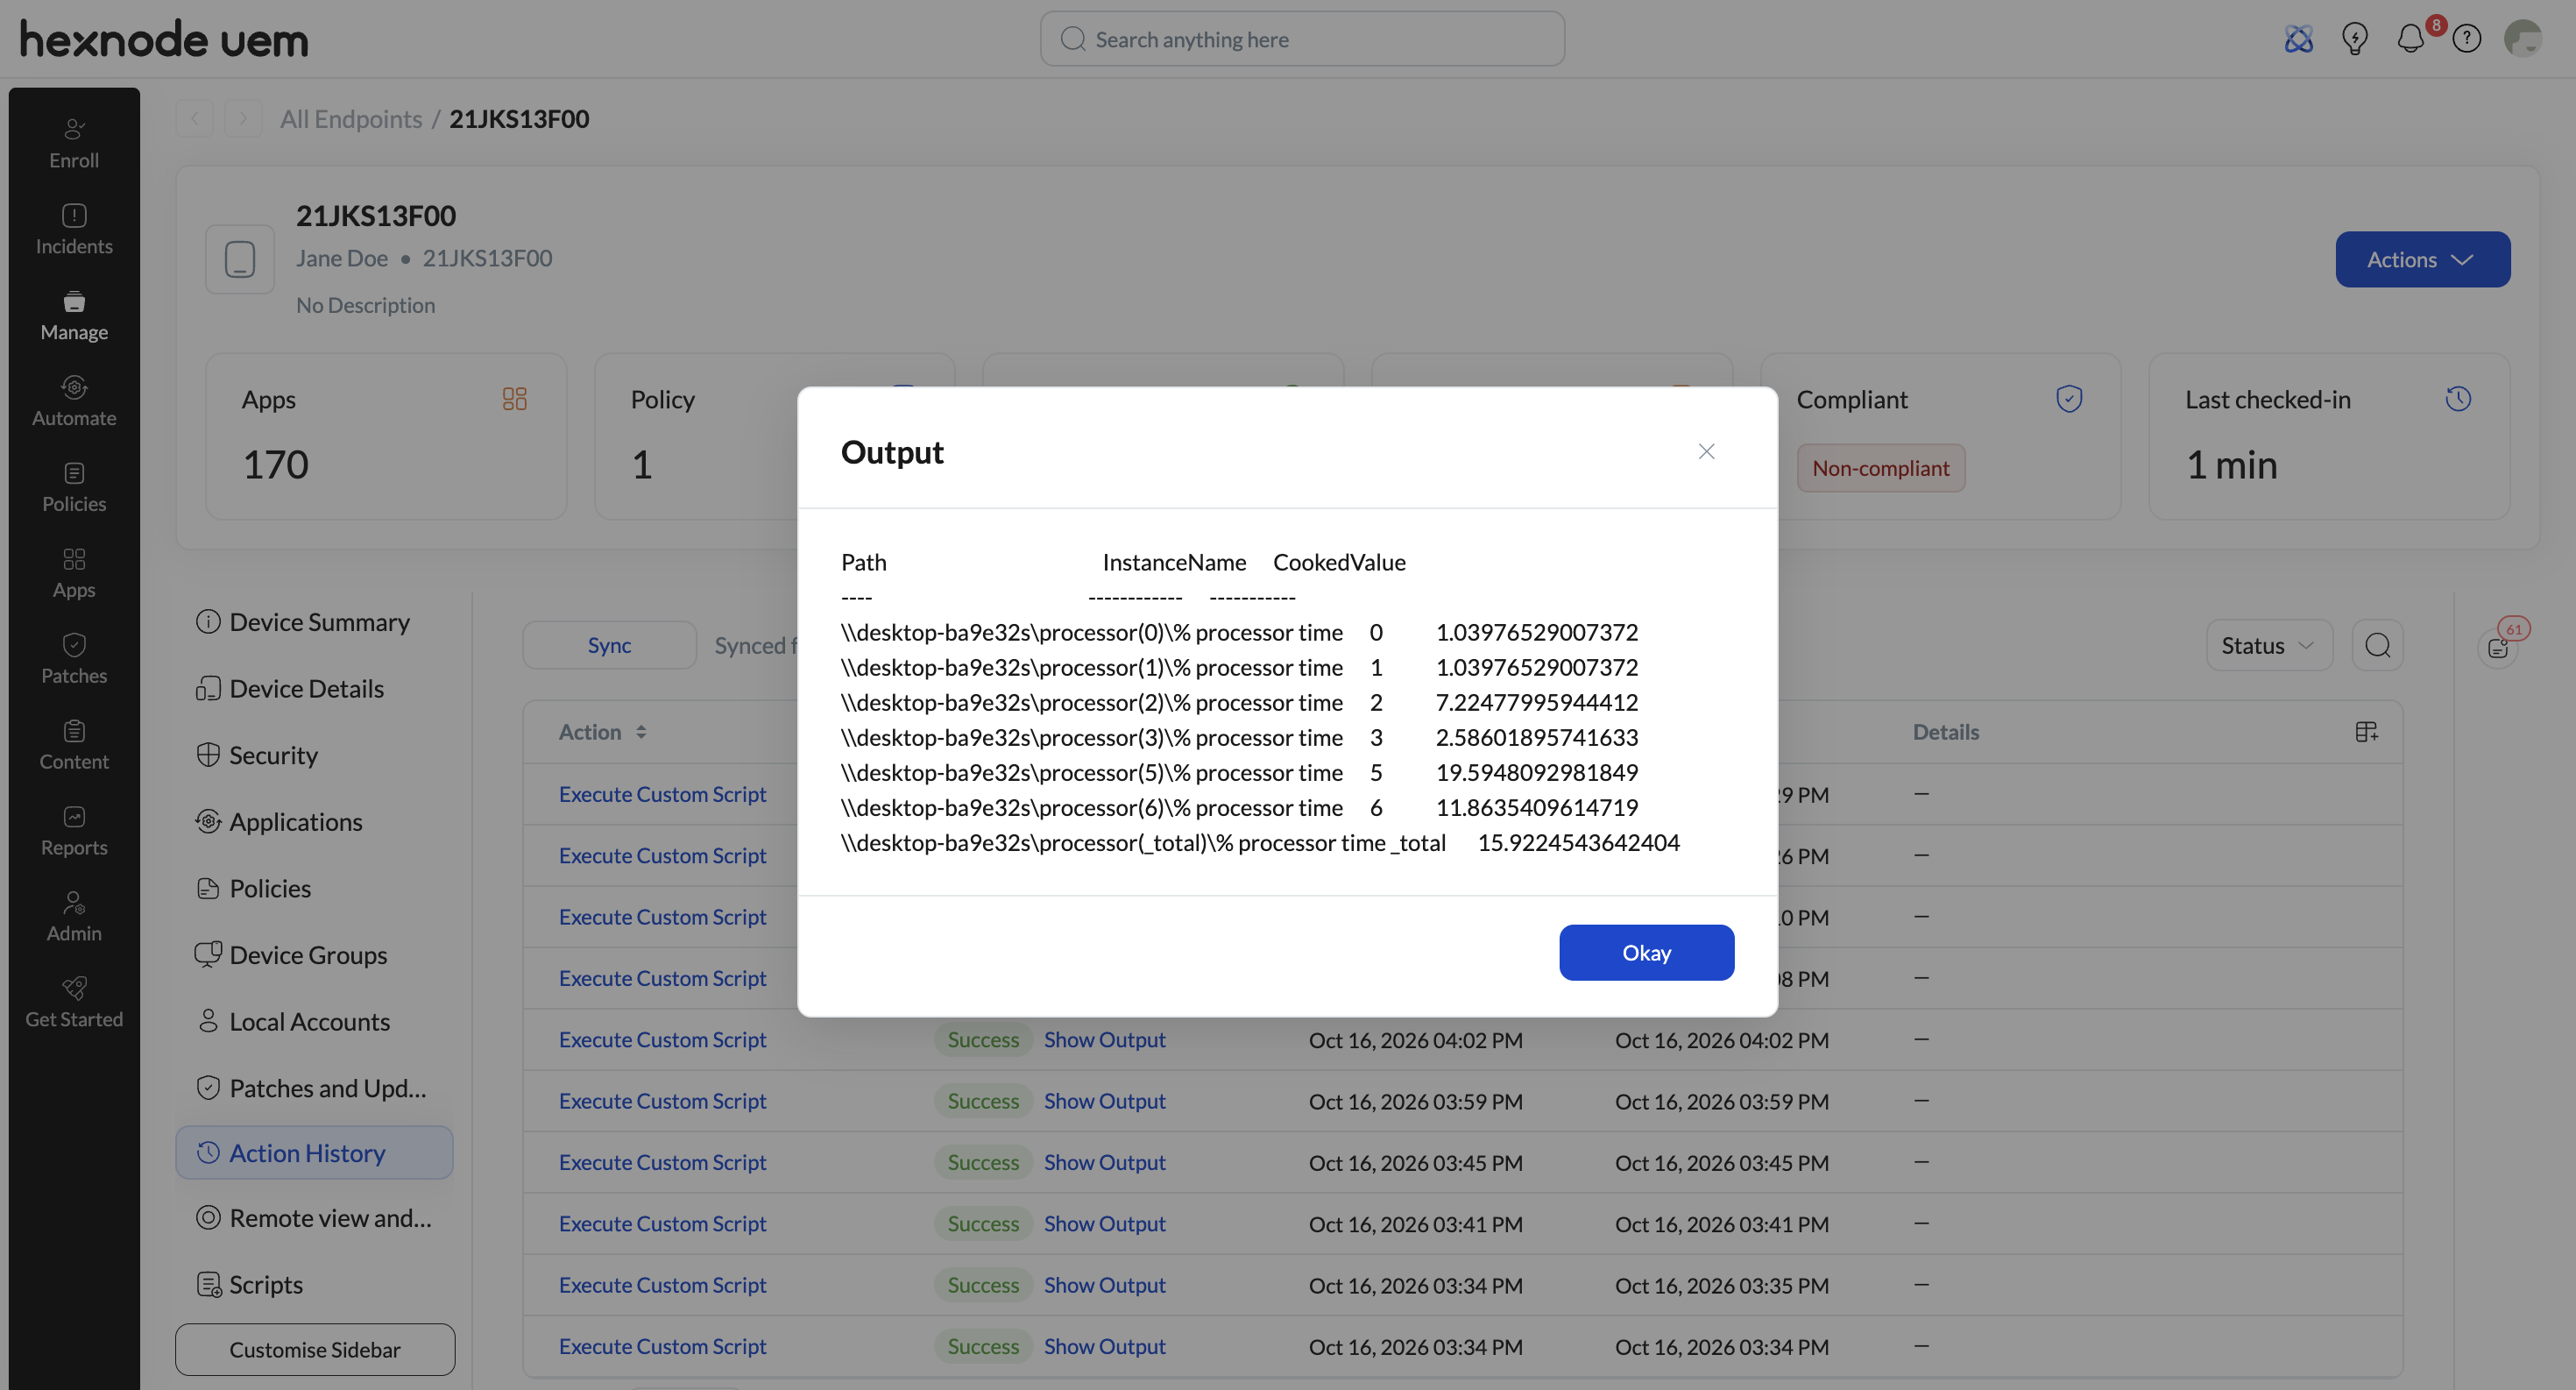
Execute the following PowerShell script through Hexnode UEM to filter processor instances operating below a defined utilisation threshold.
The example below displays CPU instances running below a 20% threshold:
|
1 2 |
$Counter = Get-Counter -Counter "\Processor(*)\% Processor Time" $Counter.CounterSamples | Where-Object { $_.CookedValue -lt "20" } |
How the script works:
| Component | Function |
|---|---|
| “\Processor(*)\% Processor Time” | Counter path that measures processor usage across all logical processor instances and the total system aggregate (_Total). |
| $Counter | Variable that stores the query results across all processor units. |
| $Counter.CounterSamples | Property that extracts the individual readings for each processor into a list. |
| Where-Object | Cmdlet that filters the list based on your comparison rule. |
| $_.CookedValue | Property that checks the calculated CPU percentage for each processor unit. |
| -lt | Comparison operator (meaning “less than”) that compares each processor’s CPU percentage against the specified limit and only outputs readings that fall below it.This can be replaced with -gt (greater than) to filter for high usage. |
| 20 | Threshold limit that filters out any core working above 20%. This can be replaced with any value (e.g., 50 or 80). |
When to use the script:
Admins can deploy this script to audit CPU workload distribution and identify underutilized logical processor instances. Filtering for processor instances operating below a specified threshold, such as 20%, helps admins detect uneven workload distribution or determine whether available processing capacity is being utilized effectively, without manually reviewing every counter reading.
11. Sort performance counter data
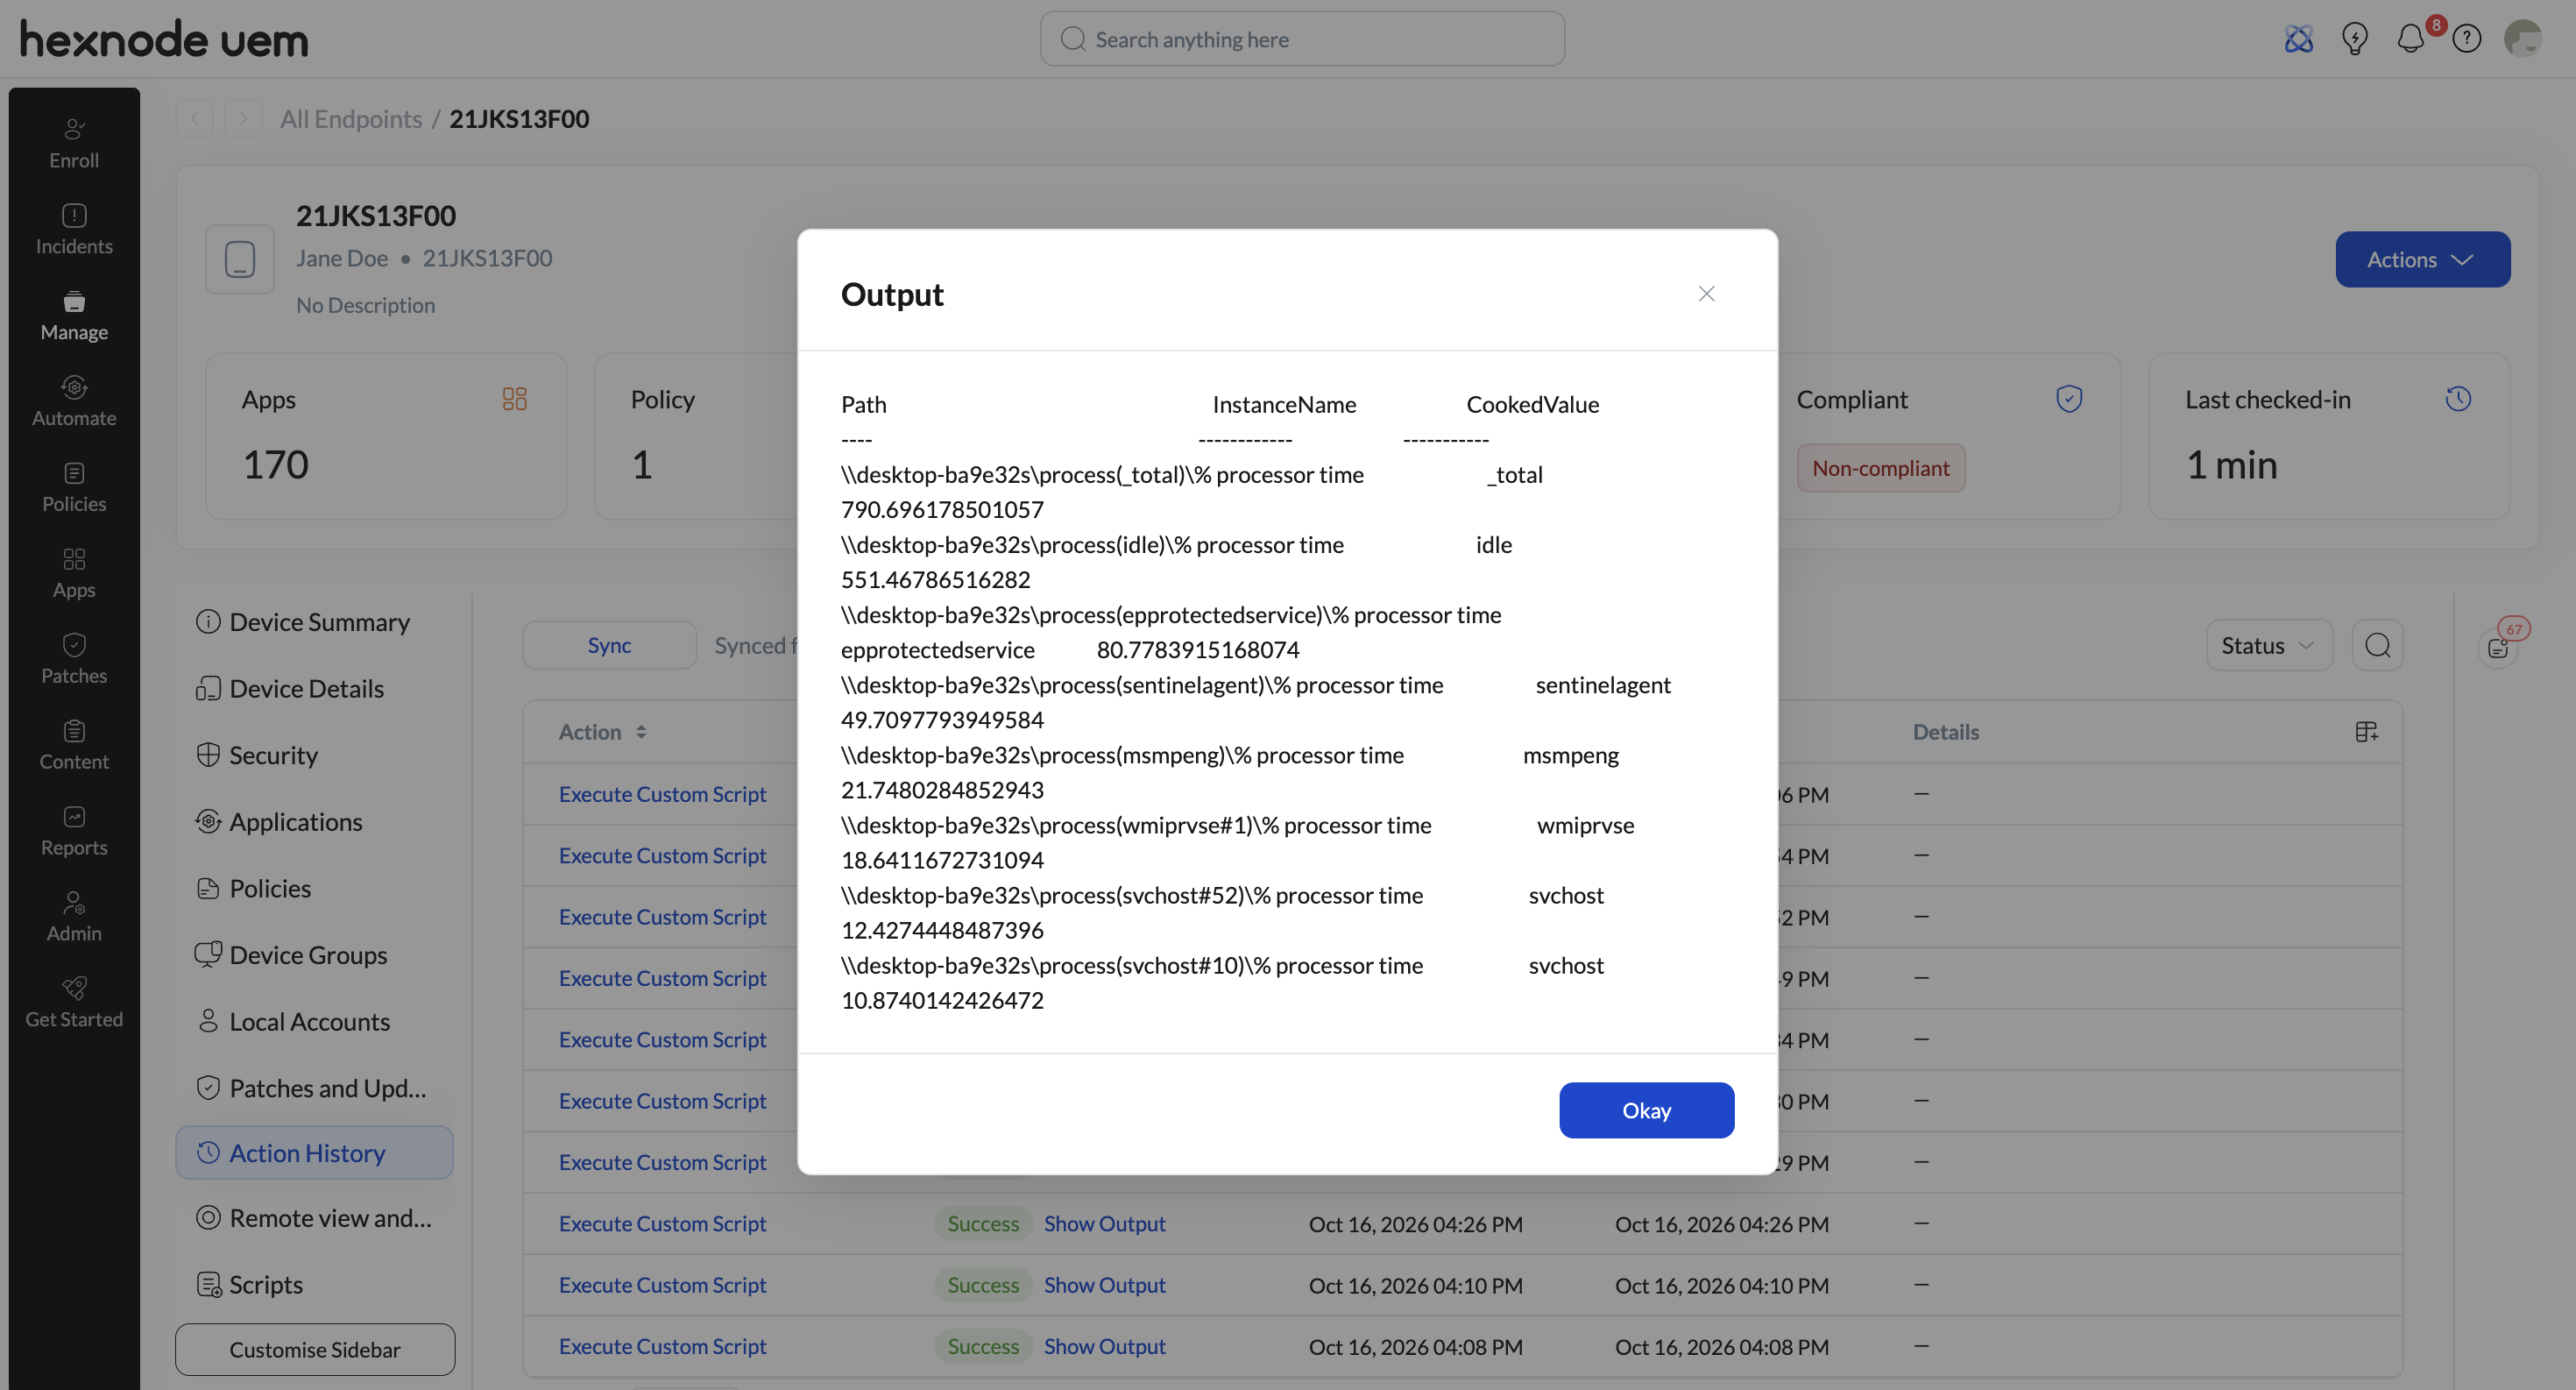
Execute the following PowerShell script through Hexnode UEM to check current CPU usage across all running processes and organize the results from highest to lowest.
|
1 2 3 |
$Procs = Get-Counter -Counter "\Process(*)\% Processor Time" $Procs.CounterSamples | Sort-Object -Property CookedValue -Descending | Format-Table -Property Path, InstanceName, CookedValue -AutoSize | Out-String -Width 300 |
How the script works:
| Component | Function |
|---|---|
| “\Process(*)\% Processor Time” | Counter path that collects CPU usage readings for all process instances, including individual processes, the system aggregate (_Total), and unused CPU cycles (Idle). |
| $Procs | Variable that saves the collected process performance readings. |
| $Procs.CounterSamples | Property that extracts the individual readings for each process into a list. |
| Sort-Object | Cmdlet that organizes the list of process readings based on specified property values. |
| CookedValue | Property that contains the calculated CPU usage value for each process instance and is used as the sorting criterion. |
| -Descending | Parameter that directs the list to be sorted from highest value to lowest value. |
| Format-Table | Cmdlet that arranges the output into clean columns. |
| -Property | Parameter that specifies the object properties (Path, InstanceName, and CookedValue) to display in the output. |
| Path | Column displaying the full performance counter path for the process. |
| InstanceName | Column displaying the process name. |
| -AutoSize | Parameter that adjusts column widths to fit the length of the text, preventing long names from being truncated. |
| Out-String | Cmdlet that converts the formatted table output into plain text strings. |
| -Width | Parameter that sets the line width to prevent long process paths and columns from wrapping or getting truncated in the script output displayed under Action History Log in Hexnode UEM. |
| 300 | Value that widens the text display area to 300 characters. This can be adjusted as needed. |
When to use the script:
Admins can run this script to quickly identify which applications or background services are consuming the most processor power. Instead of scrolling through hundreds of unsorted processes, sorting the list from highest to lowest places the heaviest CPU consumers right at the top, making it easy to spot resource-draining software or troubleshoot performance slow-downs.
Frequently Asked Questions
Does executing Get-Counter scripts noticeably affect endpoint performance?
Standard queries and single readings take minimal system resources. Only high-frequency continuous sampling (e.g., collecting samples every second for long durations) generates noticeable CPU or disk overhead.
What happens if a device is offline when the script is deployed from Hexnode UEM?
The script action will remain in a “Pending” state in the Hexnode UEM portal. As soon as the Windows device reconnects to the internet and syncs with Hexnode, the Hexnode agent will automatically execute the script and upload the output to the portal.
Can performance counter scripts be set up to run automatically on a recurring schedule in Hexnode UEM?
Recurring script execution is supported through Automation by creating a time-triggered automation (such as daily or weekly) paired with the Execute Custom Script action for targeted Windows devices or device groups.
Why are some performance counters unavailable or returning errors on Windows devices?
Performance counter availability and query results can vary depending on the Windows configuration. Common reasons include:
- OS Edition & Role Differences: Specialized counter sets (such as Hyper-V or IIS counters) exist only on devices with those specific Windows features or server roles installed.
- Corrupted Performance Registry: Windows performance counter registries can occasionally become corrupted. Rebuilding the registry via lodctr /R on the endpoint resolves missing system counter paths.
- System Language/Localization: Non-English Windows installations may fail to recognize standard English counter paths if localized path names are expected by the OS.
How to inspect specific counter paths within a set without loading all system counters?
Running Get-Counter -ListSet * queries every performance counter category on the target endpoint, which can increase the time taken by the script to return the results. To view paths for a single category (e.g., Processor or Memory), specify the category name directly:
(Get-Counter -ListSet "Processor").PathsWithInstances


