Category filter
A Guide to Process Monitoring in Linux with Scripts
In a distributed enterprise environment, maintaining visibility into Linux endpoints is a prerequisite for security and performance stability. Leveraging the Execute Custom Script action in Hexnode UEM allows IT administrators to audit system activity across an entire fleet without manual SSH intervention.
This guide explores the technical implementation of process monitoring and how it integrates into enterprise-level management workflows to ensure fleet-wide health and security.
Technical Overview: The Bash Process Auditor
The process auditor utilizes the native ps command to pull real-time telemetry. It is designed to be lightweight, non-intrusive, and compatible across most Linux distributions.
|
1 2 3 4 5 6 7 8 9 10 11 12 13 14 15 16 17 18 19 20 21 22 23 24 |
#!/bin/bash # Script: view_processes_labeled.sh # Purpose: Display processes in a labeled, vertical block format SORT_FIELD="${SORT_FIELD:-%cpu}" SORT_ORDER="${SORT_ORDER:--}" LIMIT="${LIMIT:-10}" # Showing top 10 for readability echo "============================================================" echo " PROCESS REPORT OF LINUX" echo "============================================================" # ps -eo: pid, user, pcpu, pmem, start, comm ps -eo pid,user,pcpu,pmem,start,comm --sort="${SORT_ORDER}${SORT_FIELD}" --no-header | \ head -n "$LIMIT" | \ awk '{ print "PID: " $1 print "USER: " $2 print "%CPU: " $3 print "%MEM: " $4 print "STARTED: " $5 print "COMMAND: " $6 print "------------------------------------------------------------" }' |
How It Works
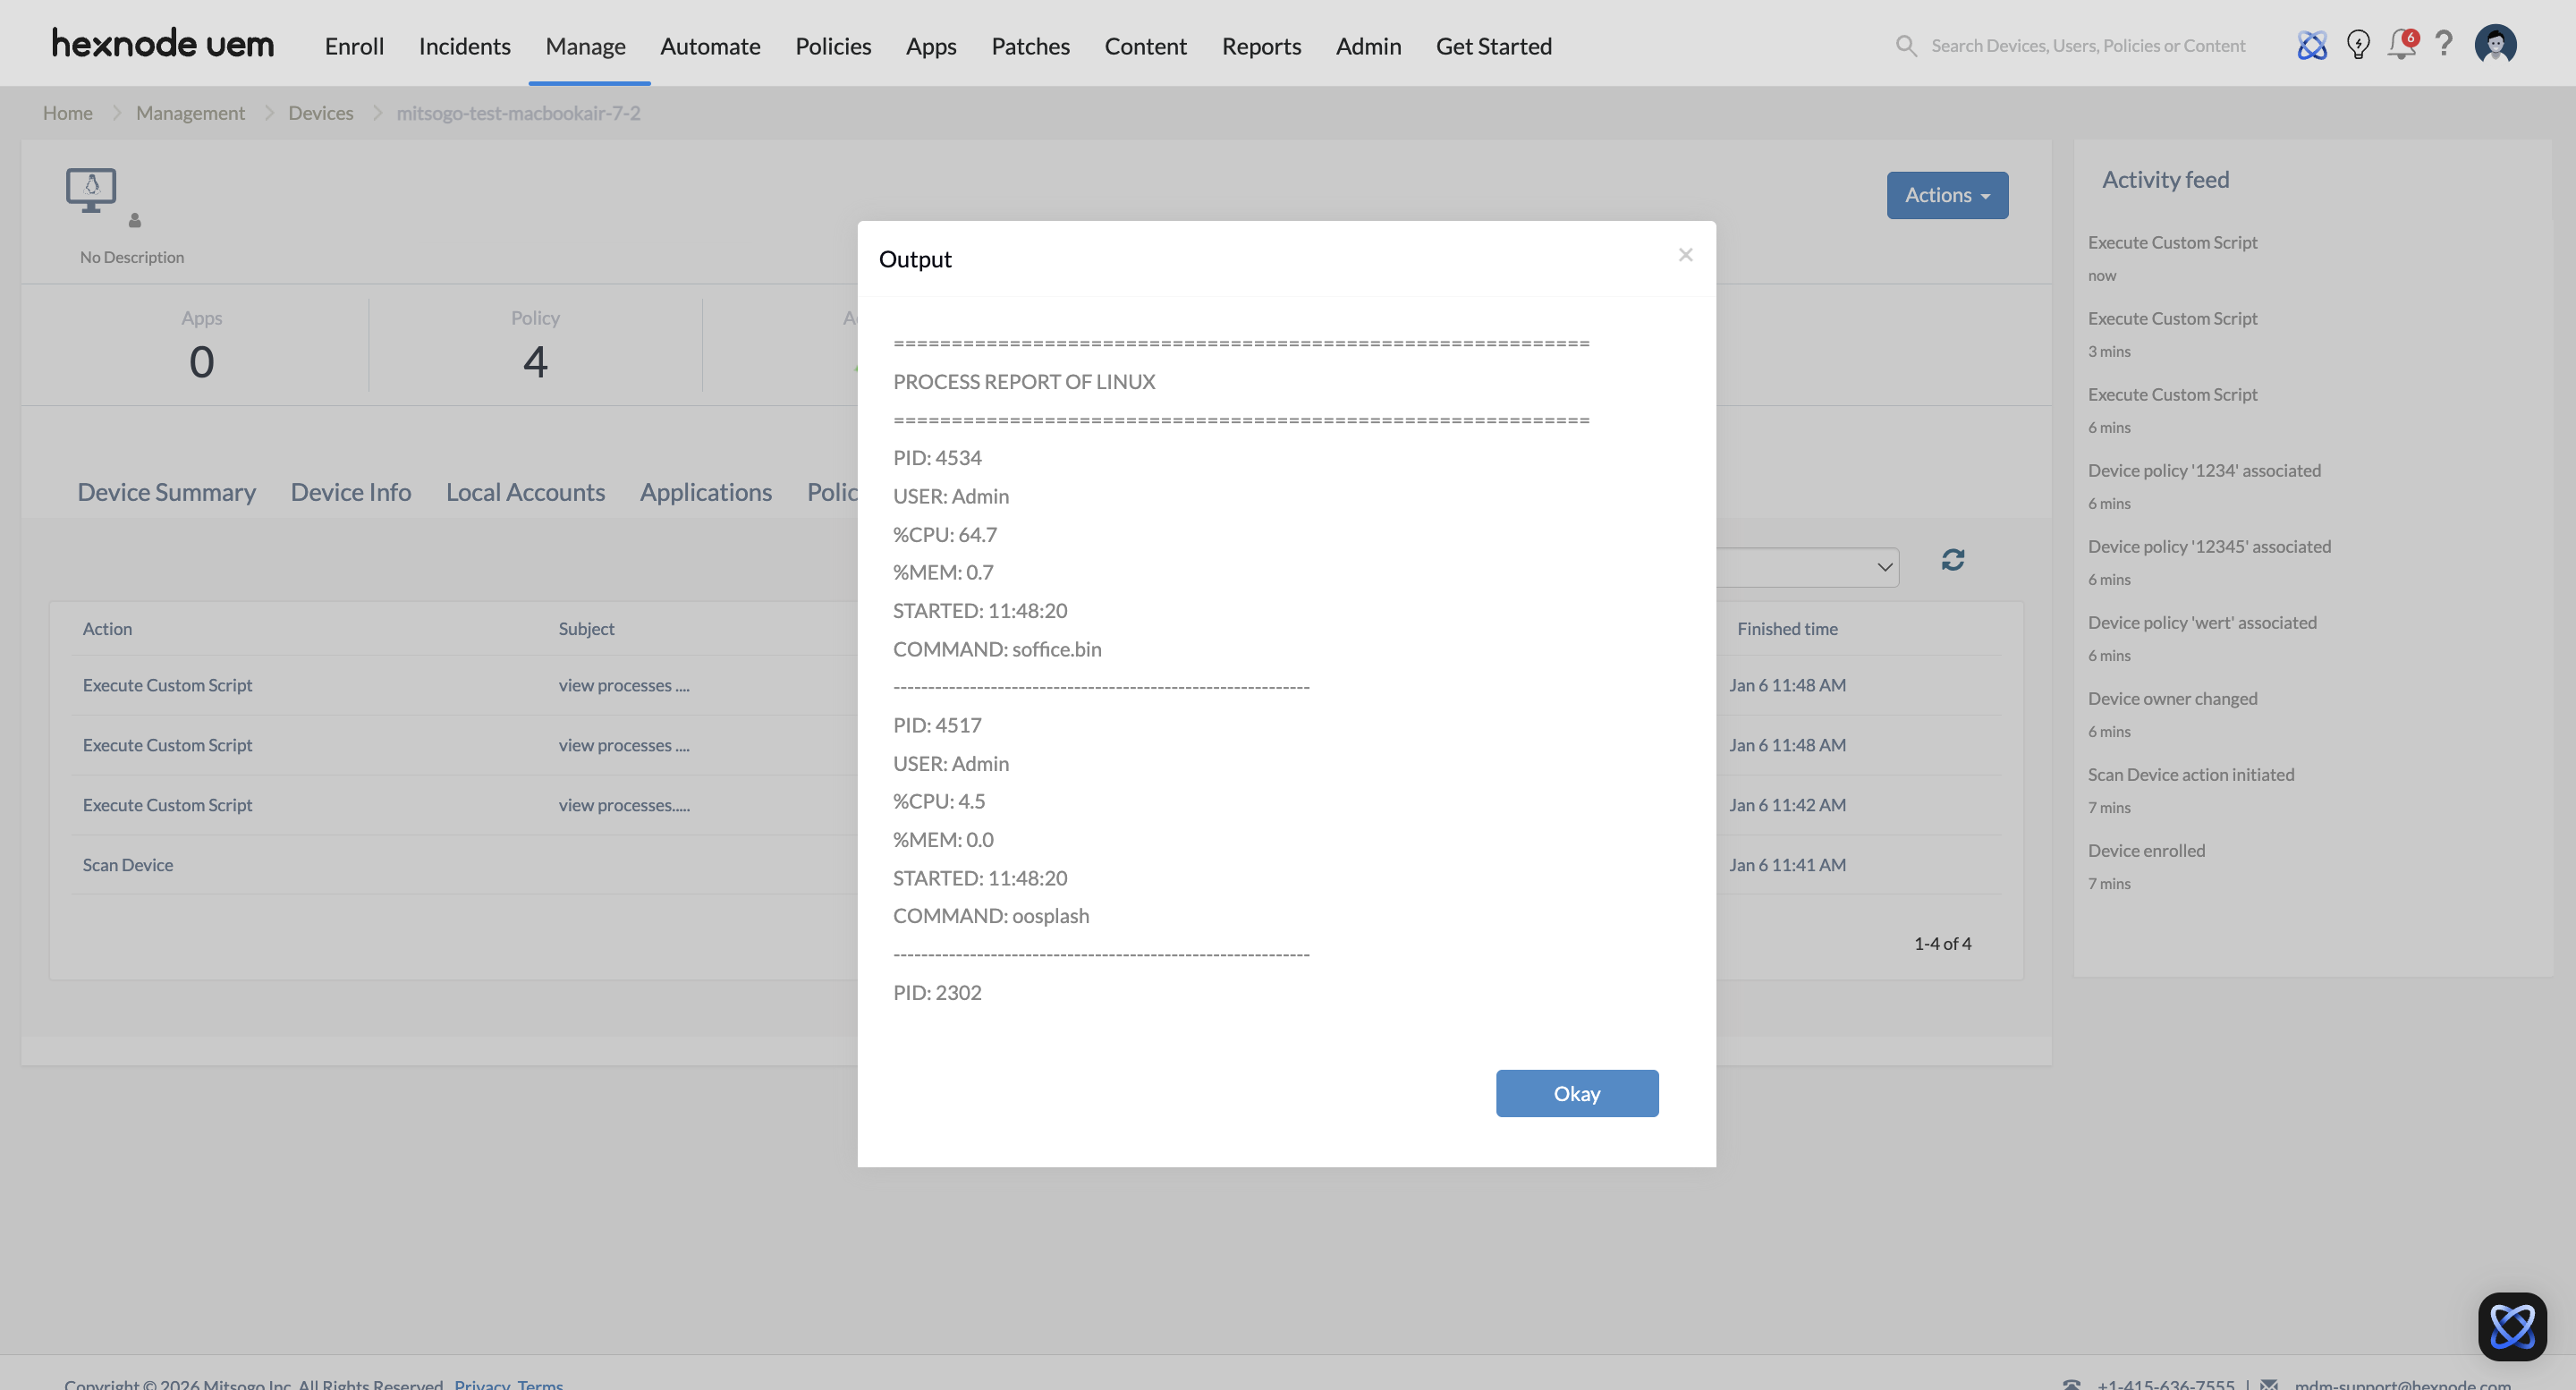
Once executed, the script identifies the top processes based on resource consumption. The output is formatted into a labeled, vertical list, making it readable in the Hexnode console. By default, it sorts by CPU usage, ensuring that “heavy” or “runaway” processes are immediately visible at the top of the report.
The Hexnode UEM output displays the Linux process report, including entries for PID, username, CPU/Memory percentages, start time, and the specific command binary.
Hexnode Deployment Strategies
The script can be deployed depending on whether you need a one-time snapshot or recurring health checks.
1. One-Time Actions (On-Demand Diagnostics)
- Navigate to Manage -> Devices.
- Select the target Linux device(s).
- Click Actions -> Execute Custom Script.
- Upload the .sh file and click Execute.
2. Automation (Scheduled Health Checks)
- Navigate to the Automate tab.
- Select Linux as the platform.
- Upload the script and define the Schedule (e.g., daily or weekly).
- Add target devices or groups and save the configuration.
Key Data Metrics Explained
| Attribute | Technical Significance | Enterprise Utility |
|---|---|---|
| PID | Unique Process Identifier | Necessary for targeted “kill” or “renice” actions. |
| USER | Ownership Context | Identifies if processes are running under root or unauthorized users. |
| %CPU | Computational Load | Pinpoints “runaway” processes causing system latency. |
| %MEM | Resident Set Size (RSS) % | Detects memory leaks in long-running enterprise applications. |
| STARTED | Uptime Duration | Identifies persistent processes that may bypass reboot-only patches. |
| COMMAND | Binary Execution Path | Verifies the legitimacy of the software being executed. |
Enterprise Use Cases
Shadow IT & Security Auditing
Scenario: An admin suspects unauthorized crypto-mining or data-exfiltration tools are running on remote developer workstations.
Hexnode Utility: Admins push the script to a “High-Risk” device group. By reviewing the USER and COMMAND fields, they can identify binaries running from /tmp or hidden directories, signaling a potential breach.
Performance Bottleneck Troubleshooting
Scenario: Users report that Linux-based POS terminals or kiosks are experiencing input lag.
Hexnode Utility: The admin runs the script with SORT_FIELD=”%mem”. Hexnode returns the top memory consumers, allowing the admin to identify if a specific container or browser instance is exhausting system resources.
