Category filter
Fetch ChromeOS device support logs from Hexnode UEM
The Device Support Logs remote action in Hexnode UEM allows IT administrators to collect comprehensive diagnostic data from managed ChromeOS devices over-the-air. This eliminates the need for physical device access while providing deep insights into hardware diagnostics, network connectivity, and system health.
Why Fetch Device Support Logs?
Accessing system logs is a critical step in identifying and resolving technical issues. These logs are essential for:
- Troubleshooting: Diagnosing browser errors, system crashes, or firmware issues.
- Performance Monitoring: Tracking memory usage and system state to ensure optimal operation.
- Security & Auditing: Monitoring user-triggered events, network connections, and enforced policies.
Prerequisites for Log Collection
To successfully download logs from the Hexnode portal, the following conditions must be met:
- Integration: The user logged into the browser must be part of the Google Workspace account integrated with Hexnode UEM.
- Permissions: The Export Logs Action privilege must be enabled within the Google Admin Console.
Step-by-Step Guide: Fetching ChromeOS Logs
Follow these instructions to request and download diagnostic information from a managed Chromebook or ChromeOS Flex device.
- Log in to the Hexnode UEM portal and navigate to the Manage tab.
- Select the target ChromeOS device.
- Click on Actions > Others > Device Support Logs.
- Select the specific diagnostic categories to include in the log file (see the Data Categories table below).
- Click on Download.
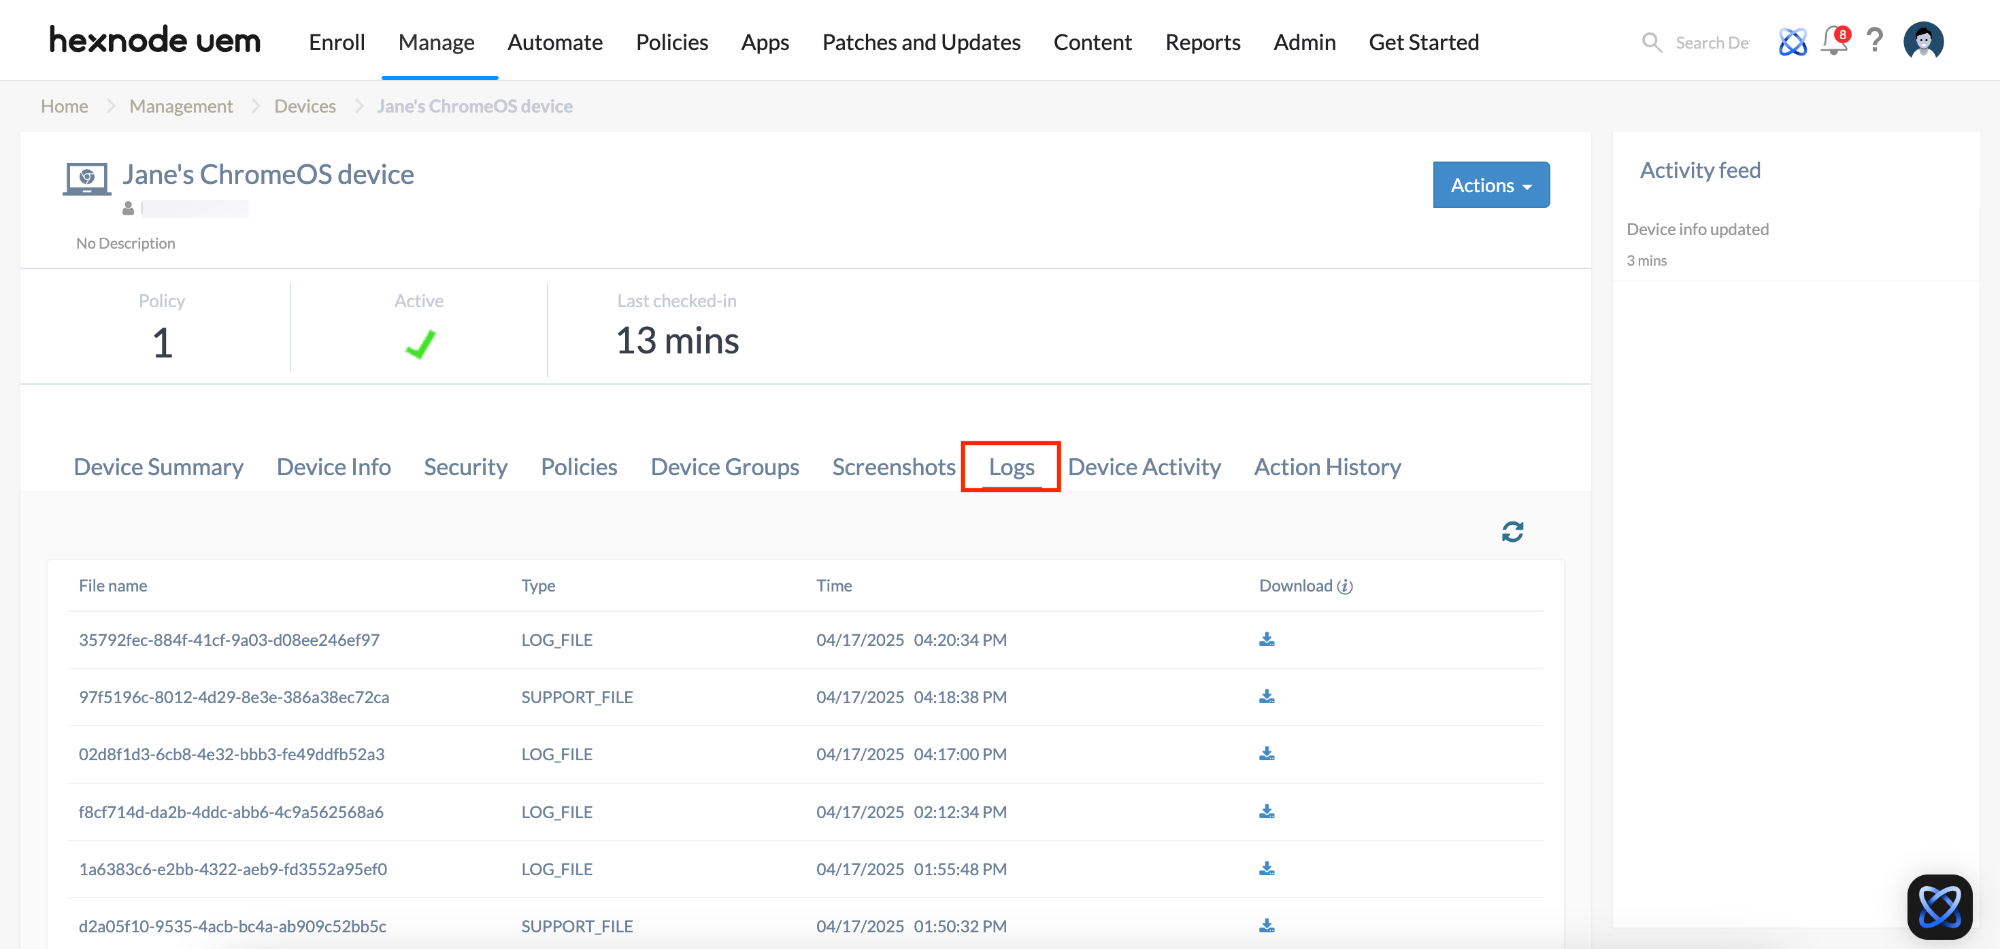
Once the action is successful, the log file will be available under the Logs sub-tab of the Device Summary page.
Available Log Data Categories
Administrators can customize the support log by selecting specific modules relevant to their troubleshooting needs:
| Category | Description |
|---|---|
| Chrome System Info | Collects browser version, internal system logs, and memory usage. |
| Network & Connectivity | Gathers IPv4/IPv6 routing tables, network health, traffic counters, and Shill (Connection Manager) logs. |
| Hardware & Diagnostics | Includes Intel Wi-Fi NICs debug dumps, touch events (touchpad/touchscreen), and connected input device info. |
| System State & Logs | Extracts logs from the /var/log directory, debug daemon logs, and D-Bus interface details. |
| Browser Specifics | Collects information for Lacros (standalone Chrome browser) and user-specific directory logs. |
| Crash & Events | Extracts recent Crash IDs and entries from network/device event logs. |
| Compliance & OS | Retrieves enforced policies, virtual keyboard info, and specific hardware data for ChromeOS Flex. |
Troubleshooting Guides
| Problem | Potential Root Cause | Resolution |
|---|---|---|
| Action fails to initiate | Device is offline or in an unsupported state. | Ensure the device is powered on and connected to the internet to receive the remote command. |
| Download is restricted | Incorrect Google Workspace user or missing permissions. | Verify you are logged into the integrated Google Workspace account and that Export Logs Action is enabled in the Google Admin Console. |
| Missing specific data | Category was not selected during the request. | Re-trigger the Device Support Logs action and ensure all relevant checkboxes (e.g., ChromeOS Network Health) are selected. |
| Log file is not appearing | Action remains in “Pending” status. | Check the Action History to ensure the command was successfully pushed to and executed by the device. |
Frequently Asked Questions (FAQs)
Can user activity be tracked through these logs?
Yes. The logs can be used to audit user activities, including login/logout timestamps and user-triggered events.
What is included in “ChromeOS System Logs”?
This category gathers data from the /var/log directory, which includes Chrome browser logs, system messages, and Bluetooth logs.
Does this work for ChromeOS Flex devices?
Yes. There is a specific ChromeOS Flex Logs option that collects pertinent hardware data for devices running the Flex version of the OS.
How to view enforced policies?
By selecting the Policies option during the log request, you can retrieve all policies currently enforced on the managed user or device.
