




Category filter
Understanding the Hexnode IdP Applications Dashboard
The Identity Provider Application Dashboard in Hexnode IdP provides administrators with a centralized overview of all applications integrated into their identity environment. It brings together key insights on application configuration status, Single Sign-On (SSO) adoption, user provisioning coverage, and application usage within a single view. By consolidating application and usage metrics, the dashboard helps administrators quickly understand integration adoption, monitor access activity, and gain visibility into how applications are being used across the organization. It serves as the starting point for viewing application insights and overall application ecosystem metrics within Hexnode IdP.
Accessing the Identity Provider Application Dashboard
- Log in to the Hexnode IdP portal.
- Navigate to Applications from the main header.
- Select the Dashboard subtab. The dashboard loads automatically with the latest application metrics.
Dashboard Components
The Identity Provider Application Dashboard is organized into widgets that present key information in a clear, visual format.
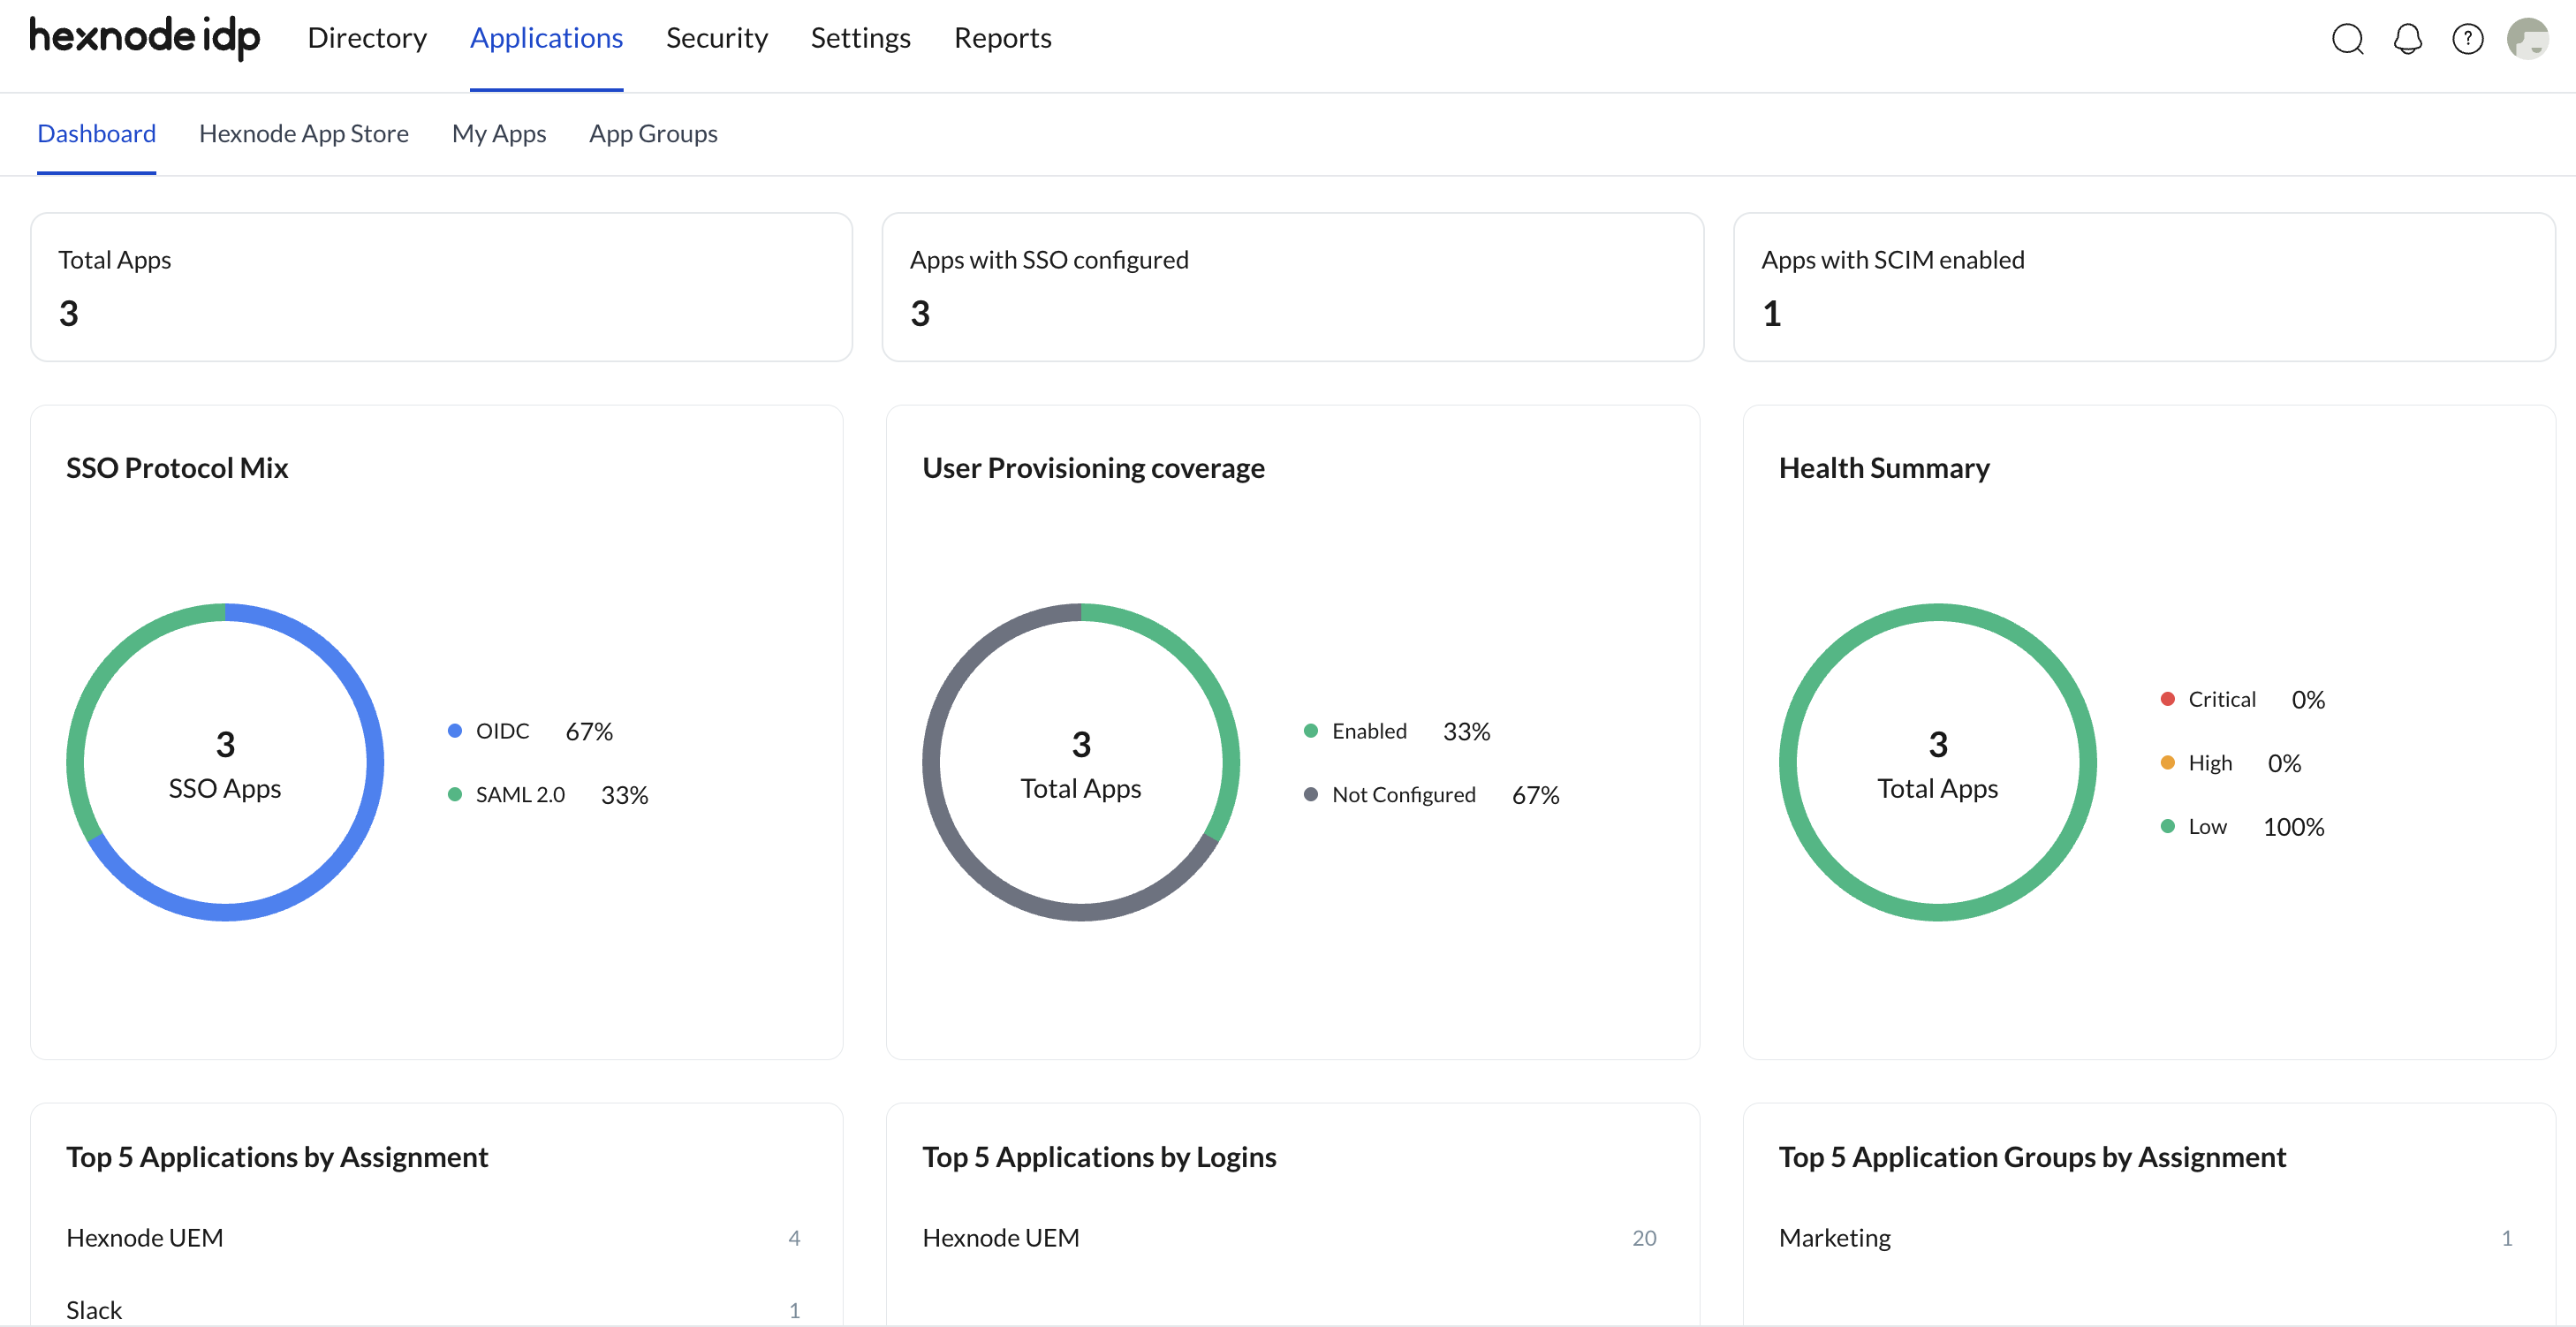
Summary Metrics
The top section displays high-level statistics about your application environment.
- Total Apps: Shows the total number of applications added and managed in Hexnode IdP.
- Apps with SSO Configured: Displays how many applications currently support Single Sign-On, allowing users to authenticate using centralized credentials.
- Apps with SCIM Enabled: Indicates the number of applications configured for SCIM-based automated user provisioning and deprovisioning.
These metrics help administrators quickly evaluate overall integration progress.
Configuration and Health Insights
This section provides visibility into how applications are configured and highlights the operational health of application integrations within Hexnode IdP.
- SSO Protocol Mix: Displays the distribution of applications based on the authentication protocol configured for Single Sign-On. It shows the total number of integrated applications along with the percentage split between SAML and OpenID Connect (OIDC/OAuth) configured apps, helping administrators understand protocol adoption across the environment.
- User Provisioning Coverage: Shows the ratio of applications with and without user provisioning (SCIM) configured. This widget also reflects the total number of directory users and provides a comparison between provisioned users and non-provisioned users across integrated applications.
- Health Summary: Provides a consolidated view of application integration health by displaying the count of applications experiencing SSO or SCIM-related issues. The widget highlights:
- the ratio of SCIM synchronization failures
- the ratio of SSO login errors
This helps administrators quickly identify integrations that require attention and troubleshoot access or provisioning problems.
Usage and Assignment Metrics
These widgets highlight how applications are being used within the organization.
- Top 5 Applications by Assignment: Lists applications assigned to the largest number of users or groups, helping identify core business tools.
- Top 5 Applications by Logins: Displays the most frequently accessed applications based on authentication activity, offering insight into real user adoption.
- Top 5 Application Groups by Assignment: Shows application groups most commonly assigned across the directory, helping administrators evaluate access distribution strategies.
Recent Activity
Located at the bottom of the dashboard, this section tracks newly integrated applications.
Recently Added Apps includes:
- Application – Name and icon of the application
- Status – Active or inactive integration state
- SSO – Indicates whether Single Sign-On is enabled
- Added By – Technician who added the application
Select View all Apps to navigate to the complete application inventory for further management.
Frequently Asked Questions
What does the Identity Provider Application Dashboard show when no apps are added?
When no applications are integrated, the dashboard widgets display empty states or zero values. Metrics and charts begin populating automatically once applications are added and configured.
How often is dashboard data updated?
Dashboard metrics reflect the latest available application and login data. Updates occur automatically as application configurations and user activities change.
Why is an application not appearing under Top Applications by Logins?
Only applications with recorded authentication activity appear in login-based metrics. Newly added or unused applications may not be listed until user logins occur.
Does enabling SSO automatically enable SCIM provisioning?
No. SSO and SCIM are configured independently. An application can support SSO without automated provisioning, and vice versa.


