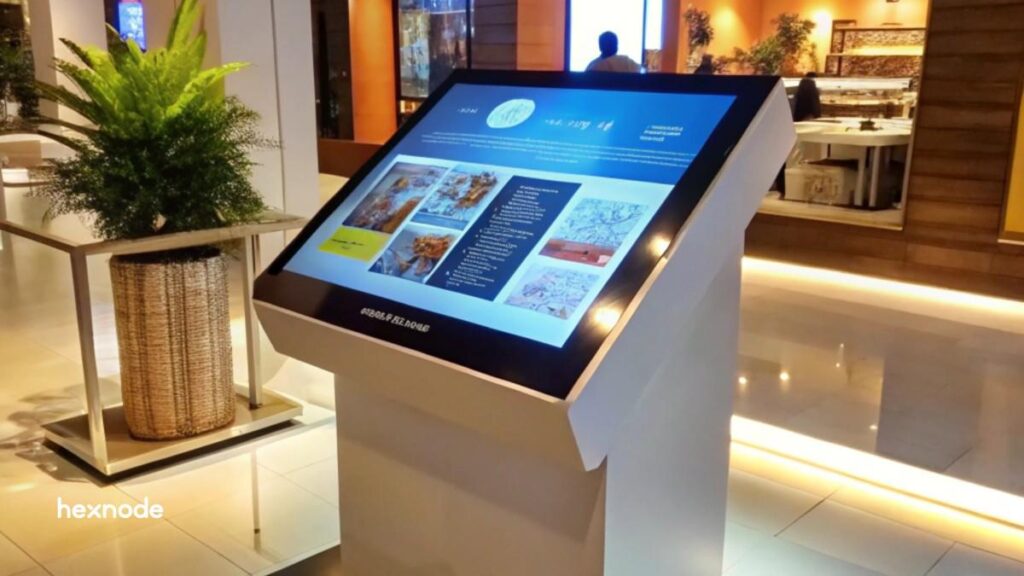
Why is measuring kiosk performance more difficult than it looks?
To measure kiosk performance KPIs accurately, IT teams must look beyond whether a device is powered on. Availability does not confirm that the kiosk can complete its intended task.
Relevant data often sits across device management, kiosk applications, transaction systems, and support tools. This fragmentation makes it difficult to understand the complete service experience or identify the source of a failure.
A powered-on kiosk may still be disconnected, unresponsive, incorrectly configured, or unable to process transactions. Effective measurement must determine whether the kiosk is available and usable throughout its scheduled service period.
What happens when kiosk performance is not measured?
Without performance data, kiosk management becomes reactive. IT teams often learn about failures only after customers or employees report them, increasing resolution time and support effort.
The business effects extend beyond IT:
Interrupted or abandoned transactions
Longer queues and more employee intervention
Repeated service calls and higher support costs
Lower customer confidence in self-service options
Fleet-wide averages can also create a false sense of stability. Breaking results down by location, device model, and kiosk application helps teams identify where failures occur most often and where corrective action will have the greatest impact.
Kiosk Analytics: Tracking Usage & Performance with Hexnode
Track kiosk usage, performance, security, and compliance analytics effectively.
Which KPIs should organizations use to measure kiosk performance?
Kiosk performance KPIs measure three areas: technical availability, recovery efficiency, and successful user interactions. Organizations should evaluate uptime, mean time to respond or restore (MTTR), and customer experience KPIs together. No single metric shows whether a kiosk is both operational and effective.
How should kiosk uptime be calculated?
Kiosk uptime is the percentage of scheduled service time during which the kiosk is available for its intended function.
Uptime (%) = Available service time ÷ Total scheduled service time × 100
For example, a kiosk available for 99 of 100 scheduled hours has 99% uptime. However, teams must define “available” before comparing results. A powered-on device should not count as available if it cannot connect to the required service, run its application, or complete its intended task.
The calculation should specify:
Scheduled operating hours
Treatment of planned maintenance
Required network connectivity
Applications and peripherals needed for operation
Conditions that qualify as degraded or unavailable service
Consistent definitions make uptime comparable across locations and reporting periods.
What does MTTR reveal about kiosk support?
MTTR shows how quickly teams restore kiosk service after an incident. It helps identify delays in detection, diagnosis, and remediation.
MTTR (mean time to restore) = Total time spent restoring service ÷ Number of resolved incidents
Organizations should specify whether MTTR means mean time to repair, restore or resolve, since these endpoints may differ. For example, replacing a failed component may complete the repair, but service is not fully restored until the kiosk passes validation and resumes operation.
Teams can break recovery time into:
Failure detection
Initial diagnosis
Technician response
Remediation
Service validation
This breakdown reveals whether delays come from weak monitoring, limited remote access, technician availability, replacement-part delivery, or testing.
Which customer experience KPIs matter for kiosks?
Customer experience KPIs show whether users can complete the task for which the kiosk was deployed.
Useful measures include:
Task-completion rate: Percentage of initiated tasks completed successfully
Transaction-success rate: Percentage of attempted transactions processed successfully
Abandonment rate: Percentage of sessions users leave before completion
Average completion time: Time required to finish a task
Error rate: Frequency of application or transaction errors
Assistance rate: Percentage of sessions requiring employee help
Optional customer satisfaction (CSAT) prompts can reveal usability issues that technical data may miss. Segmenting results by location, kiosk purpose, device model, application version, and period helps teams identify where those issues occur.
How can organizations build a kiosk performance measurement framework?
A kiosk performance framework is a repeatable process for defining service expectations, collecting data, calculating KPIs, and addressing exceptions. Before setting targets, IT operations, support teams, and business owners should agree on what each metric means. The framework should measure both technical reliability and successful customer outcomes.
Step 1: Define the kiosk’s purpose and service baseline
Start by defining what the kiosk must do and when it must be available. Record its:
Primary task
Operating schedule
Expected transaction volume
Acceptable interruption threshold
Teams should also define when a kiosk is available, degraded or unavailable, when an incident begins, and when service is considered restored. Use current performance as the baseline before setting targets or comparing locations.
Step 2: Collect data across the complete kiosk journey
Combine data from device check-ins, connectivity monitoring, application events, transaction records, support tickets, and customer feedback.
Use consistent kiosk, location, incident, and timestamp identifiers across these systems. This makes it easier to connect a failed transaction or support request with the relevant device event.
Separate planned maintenance from unplanned downtime. Teams should also classify whether an incident originated from the device, kiosk application, network, or connected peripheral.
Step 3: Build a practical KPI scorecard
A scorecard should contain only metrics that support a clear operational decision.
KPI
Calculation
Data source
Owner
Target
Review frequency
Uptime
Available time ÷ scheduled time × 100
Device and service monitoring
IT operations
Set from baseline
Weekly
Mean time to restore
Total service downtime ÷ number of service interruptions
The scorecard should balance leading indicators, such as missed check-ins or declining storage, with outcomes such as downtime and failed transactions.
Step 4: Review trends and improve the kiosk fleet
Review performance by location, device model, application version, incident type, and support team. This helps identify patterns hidden by fleet-wide averages.
Investigate recurring failures and unusually high MTTR. Use the findings to adjust alert thresholds, maintenance schedules, device replacement plans, and support procedures.
Featured resource
The Ultimate Guide to Kiosk Management
Learn how to secure, manage and scale kiosk deployments with an effective kiosk management strategy.
How can Hexnode support kiosk performance monitoring and recovery?
Hexnode UEM provides operational data that can support performance monitoring across managed kiosk devices:
Kiosk status report
Kiosk active devices list devices currently locked in kiosk mode. These devices identify devices with an assigned kiosk policy that are not currently in kiosk mode, while Kiosk exited devices lists devices that have exited kiosk lockdown.
Device activity reports
Active and Inactive device reports show whether managed kiosk devices have responded within the configured inactivity period. Last Checked-in Time helps identify devices that have stopped communicating.
Device inventory data
Available battery and storage fields provide additional context when investigating degraded or unavailable kiosks. Data availability can vary by platform.
Scheduled Reports
Administrators can schedule supported reports for delivery to technicians, enabling periodic reviews of kiosk status and device activity.
Remote support
Remote View helps technicians inspect kiosk screens, while Remote Control supports remote interaction and remediation. Availability depends on the device platform, enrollment type, and configuration.
Hexnode provides device-level operational data, but transaction success, abandonment, task completion, and customer satisfaction require data from the kiosk application, transaction platform, or feedback system.
FAQs
What is a good uptime target for a self-service kiosk?
A suitable uptime target depends on the kiosk’s operating schedule, business purpose and acceptable interruption level. Organizations should establish a baseline and then set targets based on service requirements rather than adopting one fleet-wide benchmark.
Should planned maintenance count as kiosk downtime?
Planned maintenance can be excluded if the uptime definition and service agreement specify that treatment. Teams should still track it separately to understand the kiosk’s total period of unavailability.
How often should kiosk performance KPIs be reviewed?
Review frequency should match the urgency of each metric. Device check-ins and outages may require daily monitoring, while MTTR and long-term performance trends can be reviewed weekly or monthly.
Turn kiosk metrics into operational improvements
Reliable measurement starts with consistent visibility into kiosk status, device activity, and operational issues. Hexnode UEM centralizes device reporting and supports remote management on compatible devices, helping IT teams reduce monitoring blind spots and improve the inputs used to measure kiosk performance KPIs.
Evaluate Hexnode against your kiosk fleet, platform requirements, and reporting workflow. Start a free trial or request a demonstration to explore its kiosk management capabilities.
Improve visibility across every kiosk.
Start your free trial and manage kiosk performance with Hexnode.
A storyteller for practical people. Breaks down complicated topics into steps, trade-offs, and clear next actions—without the buzzword fog. Known to replace fluff with facts, sharpen the message, and keep things readable—politely.